Level:
Correct: 0
Incorrect: 0
Marks: 0/0
Practice
Course:
Topics:
Year 8 Maths Smart practice A mixed round aimed at your weak spots
Unit 1
Number: accuracy, powers and standard form
Unit 2
Fractions, decimals and percentages
Unit 3
Algebraic expressions
Unit 4
Equations, inequalities and formulae
Unit 5
Sequences and graphs
Unit 6
Ratio, proportion and rates of change
Unit 7
Circles, area and volume
Unit 8
Angles and constructions
Unit 9
Transformations and symmetry
Unit 10
Probability
Unit 11
Statistics
Avg
score:
–
Topics
done:
0/50

Experimental probability and relative frequency

Practise 26 questions on Experimental probability and relative frequency for Year 8 Maths. Write your answer and get it marked in seconds against the mark scheme, point by point, with the Study Helper on hand if you get stuck.

  • 26 questions
  • 1–5 marks each
  • Instant marking
  • No sign-up needed
20 questions, marked as you go

Sample questions with model answers

Here are 4 of the questions in this topic, each with a model answer, an explanation of why it earns the marks and the mark scheme.

Question 1

1 mark

Kirsty spins a spinner 60 times.
The relative frequency of blue is 0.3.

How many times did the spinner land on blue?

Model answer

Number of blues = \(0.3 \times 60 = 18\)

Explanation

The relative frequency is the fraction of the spins that were blue, so blue came up on 0.3 of the 60 spins. 0.1 of 60 is 6, so 0.3 of 60 is 18. A common mistake is to divide 60 by 0.3 instead of multiplying.

Mark scheme
  1. 1 mark

    18

    Do not accept 0.3, 20 or 200 (dividing 60 by 0.3). A correct answer with no working scores full marks.

Question 2

2 marks

A bag contains 3 red counters and 7 blue counters.
Ivy takes a counter at random, writes down its colour and puts it back. She does this 50 times.

How many times would you expect Ivy to take a red counter?

Model answer

P(red) = \(\dfrac{3}{10}\) = 0.3
Expected number of reds = \(0.3 \times 50 = 15\)

Explanation

The bag has 3 + 7 = 10 counters and 3 are red, so P(red) = \(\dfrac{3}{10}\). Because Ivy puts the counter back each time, this probability stays the same for all 50 goes, so she can expect red on about \(0.3 \times 50 = 15\) of them. A common mistake is to use \(\dfrac{3}{7}\), red compared with blue, instead of red out of all 10 counters.

Mark scheme
  1. 1 mark

    P(red) = \(\dfrac{3}{10}\) (or 0.3); or the correct answer 15 with no working

    Do not accept \(\dfrac{3}{7}\) for P(red).

  2. 1 mark

    15

    Accept 'about 15'. Do not accept 21 or 21.4 (from \(\dfrac{3}{7} \times 50\)) or 25. A correct answer with no working scores full marks.

Question 3

3 marks

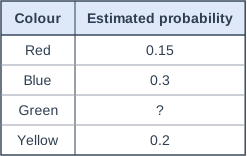
Kofi has a biased spinner. He uses an experiment to estimate the probability of each colour.
The table shows his estimates. The estimate for green is missing.

Kofi is going to spin the spinner 300 times.
Work out an estimate for the number of times it will land on green.

Table with columns "Colour", "Estimated probability". Colour: Red; Estimated probability: 0.15 | Colour: Blue; Estimated probability: 0.3 | Colour: Green; Estimated probability: ? | Colour: Yellow; Estimated probability: 0.2.

Model answer

P(green) = 1 - 0.15 - 0.3 - 0.2 = 0.35
Estimate = \(0.35 \times 300 = 105\)

Explanation

The probabilities of all the colours add up to 1, so green's estimate is 1 - 0.65 = 0.35. The expected number of greens is the probability times the number of spins: \(0.35 \times 300\). One way: \(0.35 \times 100 = 35\), and \(35 \times 3 = 105\). A common mistake is to stop at 0.35.

Mark scheme
  1. 1 mark

    0.15 + 0.3 + 0.2 = 0.65, or 1 - 0.15 - 0.3 - 0.2; or the correct answer 105 with no working

  2. 1 mark

    P(green) = 0.35

    Accept 35% or \(\dfrac{7}{20}\).

  3. 1 mark

    105

    Follow through \(300 \times\) their P(green). Accept 'about 105'. Do not accept 0.35 as the final answer. A correct answer with no working scores full marks.

Question 4

4 marks

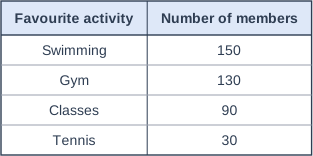
A sports centre asked all 400 of its members which activity they like best. The table shows the results.

One of these members is chosen at random. Work out the probability that the member likes the gym or classes best.

A second sports centre has 600 members. Use the results to estimate how many members of the second centre like swimming best.

Table with columns "Favourite activity", "Number of members". Favourite activity: Swimming; Number of members: 150 | Favourite activity: Gym; Number of members: 130 | Favourite activity: Classes; Number of members: 90 | Favourite activity: Tennis; Number of members: 30.

Model answer

P(gym or classes) = \(\dfrac{130 + 90}{400} = \dfrac{220}{400}\) = 0.55
Swimming: \(\dfrac{150}{400}\) = 0.375
Estimate = \(0.375 \times 600 = 225\) members

Explanation

Each member chose only one activity, so 'gym' and 'classes' are mutually exclusive: add to get 220 of the 400 members, or 0.55. For the second centre, use the first centre's relative frequency for swimming, \(\dfrac{150}{400}\), as an estimate. The second centre is 1.5 times as big, so expect about \(1.5 \times 150 = 225\) members who like swimming best. A common mistake is to say 150, forgetting that the second centre has more members.

Mark scheme
  1. 1 mark

    130 + 90 = 220, or \(\dfrac{130}{400} + \dfrac{90}{400}\); or the correct answers 0.55 and 225 with no working

  2. 1 mark

    P(gym or classes) = \(\dfrac{220}{400}\) or 0.55

    Accept 55% or any equivalent fraction such as \(\dfrac{11}{20}\). A probability written as '220 in 400', '220 out of 400' or 220 : 400 scores 0.

  3. 1 mark

    Relative frequency of swimming = \(\dfrac{150}{400}\) (= 0.375), or \(600 \div 400 = 1.5\)

  4. 1 mark

    225

    Accept 'about 225'. Do not accept 150 (the swimmers at the first centre) or 0.375. A correct answer with no working scores full marks.

Ready to try the rest? Every answer you write is marked against the mark scheme, so you can see exactly where the marks are.

Topic notes

Experimental probability and relative frequency

The big idea

You cannot always find a probability by counting equally likely outcomes. How likely is a plastic cup to land upright when you drop it? To find out, you do an experiment and count what happens. The results give an estimate of the probability.

Year 7 reminder: a probability found by counting equally likely outcomes is a theoretical probability. A fair dice or spinner has equally likely outcomes; a biased one does not.

Relative frequency

Each go in an experiment is a trial. The relative frequency of an event is the fraction of the trials in which it happened:

\[ \text{relative frequency} = \dfrac{\text{number of times the event happened}}{\text{total number of trials}} \]

The relative frequency is an estimate of the probability (it is also called the experimental probability). If the results are in a frequency table, add up all the frequencies to find the number of trials.

Expected outcomes

The expected number is roughly how many times an event will happen in a set number of trials:

\[ \text{expected number} = \text{probability} \times \text{number of trials} \]

Use the theoretical probability if you know it: a fair dice rolled 120 times should give about \(\dfrac{1}{6} \times 120 = 20\) sixes. If not, use a relative frequency. Each trial is random, so the real result is usually close to the expected number, but not exactly equal.

Ellie drops a plastic cup and records how it lands. Find the relative frequency of upright, then estimate how many of her next 350 drops will land upright.

How it landsOn its sideUprightUpside down
Frequency1341650

Number of trials: 134 + 16 + 50 = 200

Relative frequency of upright = \(\dfrac{16}{200} = \dfrac{8}{100}\) = 0.08

Expected number in 350 drops = \(0.08 \times 350 = 28\)

Is it fair?

To test a dice or spinner, work out how many times each outcome would be expected if it were fair, then compare with the results. Small differences are normal: results vary by chance. A big difference after many trials suggests that it is biased, and then you should use its relative frequencies to estimate.

A spinner has 5 equal sections: 1 red, 2 blue and 2 green. In 300 spins it lands on red 57 times, blue 124 times and green 119 times. Dan says it is biased, because blue and green came up about twice as often as red. Is he right?

If the spinner is fair, P(red) = \(\dfrac{1}{5}\) and P(blue) = P(green) = \(\dfrac{2}{5}\).

Expected reds: \(\dfrac{1}{5} \times 300 = 60\). Expected blues and greens: \(\dfrac{2}{5} \times 300 = 120\) each.

Dual bar chart of number of spins for each colour, comparing Expected if fair and Results (a key above the chart shows which bar is which). Red: Expected if fair 60, Results 57; Blue: Expected if fair 120, Results 124; Green: Expected if fair 120, Results 119.
Each result is within 4 of the number expected for a fair spinner.

Blue and green have twice as many sections as red, so they should come up about twice as often. All the results are close to the expected numbers, so Dan is not right: the spinner looks fair.

More trials give better estimates

A relative frequency from only a few trials can be a long way from the true probability. The more trials, the more reliable the estimate. When two people's results disagree, trust the one with more trials. Better still, put all the results together.

Kai drops a spoon 20 times and it lands face up 14 times. Bea drops the same spoon 180 times and it lands face up 108 times. Whose estimate is better? What is the best estimate from all the results?

Kai: \(\dfrac{14}{20} = \dfrac{7}{10}\) = 0.7

Bea: \(\dfrac{108}{180} = \dfrac{6}{10}\) = 0.6

Bea's estimate is better: she did 180 trials, and Kai did only 20.

All the results: 14 + 108 = 122 face up in 20 + 180 = 200 drops, so the best estimate is \(\dfrac{122}{200} = \dfrac{61}{100}\) = 0.61.

Do not take the number halfway between 0.7 and 0.6: Bea's 180 drops count for more than Kai's 20.

Remember

  • Relative frequency = number of times the event happened ÷ number of trials. It is an estimate of the probability.
  • Expected number = probability × number of trials.
  • The more trials, the better the estimate.
  • Results vary by chance, so a fair dice does not give exactly equal results.

Common mistakes

  • Dividing by the wrong number, such as the number of colours. Always divide by the total number of trials.
  • Dividing instead of multiplying: a relative frequency of 0.4 in 50 spins means \(0.4 \times 50 = 20\) times, not \(50 \div 0.4\).
  • Giving a probability when the question asks "how many times".
  • Using the fair probability, such as \(\dfrac{1}{4}\), after deciding that a spinner is biased.

Top tip

To decide whether something is fair, write down the numbers a fair one would give, then compare. "It is biased" with no comparison is not a reason.

Study Helper Hints first, answers after you try

Stuck on this one? Ask for a hint and I’ll point you in the right direction, without giving the answer away. Once you’ve checked your answer, I’ll show you how the marks are awarded.