Level:
Correct: 0
Incorrect: 0
Marks: 0/0
Practice
Course:
Topics:
Year 8 Maths Smart practice A mixed round aimed at your weak spots
Unit 1
Number: accuracy, powers and standard form
Unit 2
Fractions, decimals and percentages
Unit 3
Algebraic expressions
Unit 4
Equations, inequalities and formulae
Unit 5
Sequences and graphs
Unit 6
Ratio, proportion and rates of change
Unit 7
Circles, area and volume
Unit 8
Angles and constructions
Unit 9
Transformations and symmetry
Unit 10
Probability
Unit 11
Statistics
Avg
score:
–
Topics
done:
0/50

Comparing distributions

Practise 20 questions on Comparing distributions for Year 8 Maths. Write your answer and get it marked in seconds against the mark scheme, point by point, with the Study Helper on hand if you get stuck.

  • 20 questions
  • 1–5 marks each
  • Instant marking
  • No sign-up needed
20 questions, marked as you go

Sample questions with model answers

Here are 4 of the questions in this topic, each with a model answer, an explanation of why it earns the marks and the mark scheme.

Question 1

1 mark

A shop sells 7 bikes. Here are their prices.

£120   £135   £150   £150   £160   £175   £900

The price of £900 is an outlier. Which average is affected most by this outlier?

Choose your answer.

  • the mean
  • the median
  • the mode

Model answer

The mean adds up all the prices, so the £900 pulls it up.
The median and the mode are both £150 and do not depend on the £900.
The mean

Explanation

An outlier is a value much bigger or smaller than the rest. The mean is worked out from every value, so one very large price drags it upwards: here the mean is about £256, more than six of the seven prices. The median only depends on the middle value, so it hardly changes.

Mark scheme
  1. 1 mark

    the mean

    Accept "mean". The mean uses every value, so the £900 pulls it up a lot. The median (£150) and the mode (£150) would be the same if the £900 were a more ordinary price.

Question 2

2 marks

A newspaper says, "The average number of children in a family in our town is 2.4."

Which average has the newspaper used: the mean, the median or the mode? Explain how you know.

Model answer

The mean.
The mode is one of the values, so it must be a whole number.
The median is a value or halfway between two values, so it is a whole number or ends in .5.
Only the mean can be 2.4.

Explanation

The number of children in a family is always a whole number. The mode is the most common value, so it is a whole number. The median is the middle value, or halfway between two middle values, so it is a whole number or a .5. The mean shares the total out equally, so it can be 2.4.

Mark scheme
  1. 1 mark

    The mean, with a relevant but incomplete reason, e.g. "you cannot have 0.4 of a child"

    "The mean" on its own scores 0.

  2. 1 mark

    A complete correct reason: numbers of children are whole numbers, so the mode must be a whole number and the median must be a whole number or end in .5; only the mean can be 2.4

    Accept any clear explanation that rules out both the mode and the median. A complete correct reason on its own scores both marks.

Question 3

3 marks

Here are the amounts spent by 7 customers at a café one morning.

£4   £5   £5   £6   £7   £8   £63

The café puts up a sign: "Our customers spend £14 on average!"

Work out the mean and the median. Explain why the sign is misleading.

Model answer

Total = \(4 + 5 + 5 + 6 + 7 + 8 + 63 = 98\)
Mean = \(98 \div 7 = 14\), so £14
Median = 4th value = £6
The £63 is an outlier that pulls the mean up. Six of the seven customers spent £8 or less, so £14 is not typical.

Explanation

The café is using the mean, and its sum is right. But one customer spent £63, much more than the others, and that one value drags the mean up to £14. Six of the seven customers spent £8 or less. The median, £6, describes a typical customer much better. Choosing the average that sounds best is a common way to mislead.

Mark scheme
  1. 1 mark

    Mean = £14 (from \(98 \div 7\))

  2. 1 mark

    Median = £6

  3. 1 mark

    An explanation, e.g. one customer spent £63, which pulls the mean up; six of the seven customers spent £8 or less, so £14 is not a typical amount (the median, £6, is more typical)

    Must refer to the £63 (the outlier) or to most customers spending much less than £14. A complete correct explanation on its own scores this mark. The mean and the median with no working score the first two marks; the third mark needs the explanation.

Question 4

4 marks

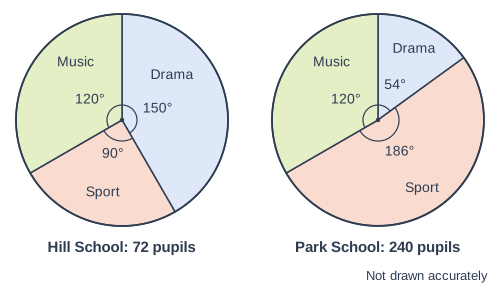
The pie charts show the favourite clubs of the pupils at Hill School and at Park School. There are 72 pupils at Hill School and 240 pupils at Park School.

Ali says, "A greater proportion of the pupils at Hill School chose drama."
Ben says, "More pupils at Hill School chose drama."

Who is right, Ali, Ben or both? Show how you know.

Two pie charts side by side, labelled "Hill School: 72 pupils" (left) and "Park School: 240 pupils" (right). "Hill School: 72 pupils": A circle divided into sectors, drawn clockwise from the top (12 o'clock): Drama, 150° (printed); Sport, 90° (printed); Music, 120° (printed). Each printed angle is marked with a small arc at the centre. "Park School: 240 pupils": A circle divided into sectors, drawn clockwise from the top (12 o'clock): Drama, 54° (printed); Sport, 186° (printed); Music, 120° (printed). Each printed angle is marked with a small arc at the centre. It is marked "Not drawn accurately".

Model answer

Hill School: \(\dfrac{150}{360} \times 72 = 30\) pupils chose drama.
Park School: \(\dfrac{54}{360} \times 240 = 36\) pupils chose drama.
Ali is right: \(150^\circ\) is bigger than \(54^\circ\), so a greater proportion chose drama at Hill School.
Ben is wrong: 36 is more than 30, so more pupils chose drama at Park School.

Explanation

The angle in a pie chart shows a proportion (a fraction of the whole), not a number of people. Hill School's drama angle is much bigger, so a bigger fraction of its pupils chose drama, and Ali is right. But Park School is much bigger, so its smaller fraction is actually more pupils: 36 compared with 30. Ben has confused proportion with number.

Mark scheme
  1. 1 mark

    Hill School drama: \(\dfrac{150}{360} \times 72 = 30\) pupils

  2. 1 mark

    Park School drama: \(\dfrac{54}{360} \times 240 = 36\) pupils

  3. 1 mark

    Ali is right: the drama angle at Hill School (\(150^\circ\)) is bigger than at Park School (\(54^\circ\)), so a greater proportion chose drama

    Accept the proportions compared as fractions, e.g. \(\dfrac{30}{72}\) is more than \(\dfrac{36}{240}\). "Ali is right" on its own scores 0.

  4. 1 mark

    Ben is wrong: more pupils chose drama at Park School (36) than at Hill School (30)

    Follow through their numbers of pupils. "Ben is wrong" on its own scores 0. The two numbers with no working score the first two marks; the last two marks need the decisions with reasons.

Ready to try the rest? Every answer you write is marked against the mark scheme, so you can see exactly where the marks are.

Topic notes

Comparing distributions

The big idea

A distribution is the whole pattern of a set of data: which values come up, and how often. To compare two distributions, compare a typical value and how spread out the values are, and say what this means in real life.

In Year 7 you found the mean, median, mode and range of a list, and read dual bar charts and pie charts.

An average and the range

  1. Work out the same average (the mean or the median) for both sets. Write a sentence saying which is higher, faster or better on average.
  2. Work out the range for both sets. Write a sentence saying which is more consistent: a smaller range means the values are closer together.

Ana recorded how many minutes late two buses were on 6 school days. If her bus is over 7 minutes late, she is late for school. Compare the buses. Which should she catch?

Route 7: 4, 6, 5, 3, 6, 6

Route 12: 0, 1, 8, 2, 10, 3

Route 7: mean \(= 30 \div 6 = 5\) minutes, range \(= 6 - 3 = 3\) minutes

Route 12: mean \(= 24 \div 6 = 4\) minutes, range \(= 10 - 0 = 10\) minutes

On average, Route 12 was less late than Route 7, because its mean is lower.

Route 7 was more consistent, because its range is smaller. Route 12 was over 7 minutes late twice, Route 7 never, so Route 7 is safer.

Choosing an average

AverageUse it when
Modethe data is categories (such as flavours), or you want the most common value
Medianthere is an outlier: a value much bigger or smaller than the rest
Meanthe values are fairly close together, or you need a total (mean × number of values = total)

An outlier drags the mean towards it and stretches the range, but hardly changes the median.

A coding club has 8 pupils and a leader. Their ages are 11, 12, 12, 13, 13, 13, 14, 14 and 51. Which average best describes a typical age?

Mean \(= 153 \div 9 = 17\) years. The median is the 5th of the 9 ages: 13 years.

The leader's age, 51, is an outlier. It pulls the mean up to 17, older than everyone except the leader. The median, 13, is a much better typical age.

It stretches the range too: \(51 - 11 = 40\) years, against \(14 - 11 = 3\) years for the pupils.

Comparing charts

In a dual bar chart, each category has two bars side by side, and a key says which is which. Read the values, then compare as usual.

The dual bar chart shows how many bikes two shops hired out on 5 days. Compare the shops using the median and the range.

Dual bar chart of number of bikes hired for each day, comparing Lakeside and Riverside (a key above the chart shows which bar is which). Mon: Lakeside 12, Riverside 8; Tue: Lakeside 15, Riverside 22; Wed: Lakeside 14, Riverside 10; Thu: Lakeside 18, Riverside 25; Fri: Lakeside 16, Riverside 20.
Bikes hired out by two shops on five days.

Lakeside in order: 12, 14, 15, 16, 18. Median 15 bikes, range \(18 - 12 = 6\) bikes.

Riverside in order: 8, 10, 20, 22, 25. Median 20 bikes, range \(25 - 8 = 17\) bikes.

On a typical day Riverside hired out more bikes, because its median is higher. Lakeside's numbers were more consistent, because its range is smaller.

A pie chart shows proportions (fractions of the whole), not numbers. When two pie charts have different totals, a bigger sector does not always mean more people.

Two pie charts side by side, labelled "Village: 60 pupils" (left) and "Town: 200 pupils" (right). "Village: 60 pupils": A circle divided into sectors, drawn clockwise from the top (12 o'clock): Walk, 120° (printed); Bus, 90° (printed); Car, 150° (printed). Each printed angle is marked with a small arc at the centre. "Town: 200 pupils": A circle divided into sectors, drawn clockwise from the top (12 o'clock): Walk, 90° (printed); Bus, 180° (printed); Car, 90° (printed). Each printed angle is marked with a small arc at the centre.
How the pupils at a village school and a town school travel to school.

The Walk sector is bigger for the village school, but it stands for \(\dfrac{120}{360} \times 60 = 20\) pupils. The town school's smaller Walk sector stands for \(\dfrac{90}{360} \times 200 = 50\) pupils.

Misleading charts and statements

A chart or statement is misleading when it gives the wrong idea. Watch out for:

  • a vertical axis that does not start at 0, which makes small differences look big;
  • uneven scales, such as the years 2016, 2018, 2019 and 2020 equally spaced;
  • pictures made twice as tall and twice as wide, which look four times as big;
  • percentages of small numbers: "up 100%" could mean 4 members became 8;
  • a mean pulled up by an outlier, used to make something sound better.

Remember

  • Compare an average and the range, with a sentence about each in context.
  • An outlier changes the mean and the range a lot, but hardly changes the median.
  • Pie charts show proportions: with different totals, work out the numbers.

Common mistakes

  • Writing only "Route 12's mean is lower". Say what it means: Route 12 was less late on average.
  • Thinking the bigger number is always better. For times or lateness, lower is better.
  • Saying every girl is taller than every boy because the girls' median is higher. An average only describes a typical value.
  • Losing a minus sign in a range: from −4 °C to 3 °C the range is \(3 - (-4) = 7\) °C, not 1 °C.

Top tip

Use sentence starters: "On average, ... because the mean is higher (or lower)" and "... was more consistent, because the range is smaller".

Study Helper Hints first, answers after you try

Stuck on this one? Ask for a hint and I’ll point you in the right direction, without giving the answer away. Once you’ve checked your answer, I’ll show you how the marks are awarded.