Level:
Correct: 0
Incorrect: 0
Marks: 0/0
Practice
Course:
Topics:
Year 8 Maths Smart practice A mixed round aimed at your weak spots
Unit 1
Number: accuracy, powers and standard form
Unit 2
Fractions, decimals and percentages
Unit 3
Algebraic expressions
Unit 4
Equations, inequalities and formulae
Unit 5
Sequences and graphs
Unit 6
Ratio, proportion and rates of change
Unit 7
Circles, area and volume
Unit 8
Angles and constructions
Unit 9
Transformations and symmetry
Unit 10
Probability
Unit 11
Statistics
Avg
score:
–
Topics
done:
0/50

Grouped data

Practise 20 questions on Grouped data for Year 8 Maths. Write your answer and get it marked in seconds against the mark scheme, point by point, with the Study Helper on hand if you get stuck.

  • 20 questions
  • 1–5 marks each
  • Instant marking
  • No sign-up needed
20 questions, marked as you go

Sample questions with model answers

Here are 4 of the questions in this topic, each with a model answer, an explanation of why it earns the marks and the mark scheme.

Question 1

1 mark

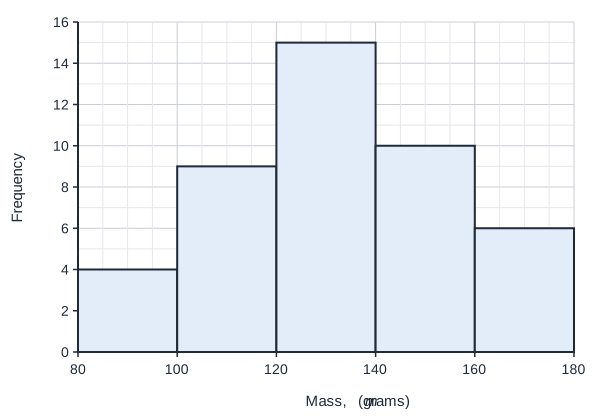
Jade weighed some apples. The frequency diagram shows their masses, \(m\) grams. The classes are \(80 \le m < 100\), \(100 \le m < 120\), and so on.

Write down the modal class.

A frequency diagram on a grid. The horizontal axis is "Mass, m (grams)", numbered every 20 from 80 to 180. The vertical axis is "Frequency", numbered every 2 from 0 to 16, with a grid line every 1. There are 5 bars with no gaps between them: from 80 to 100 it reaches 4, from 100 to 120 it reaches 9, from 120 to 140 it reaches 15, from 140 to 160 it reaches 10 and from 160 to 180 it reaches 6.

Model answer

The tallest bar is from 120 to 140, with frequency 15.
Modal class = \(120 \le m < 140\)

Explanation

In a frequency diagram, the height of each bar is the frequency of that class. The modal class is the class with the tallest bar: 15 apples have masses in the class \(120 \le m < 140\). A common mistake is to give the height of the bar instead of the class.

Mark scheme
  1. 1 mark

    \(120 \le m < 140\)

    Accept the class typed in any clear way, e.g. 120 <= m < 140, 120 to 140 or 120-140. Do not accept 15 (the frequency) or 130. A correct answer with no working scores full marks.

Question 2

2 marks

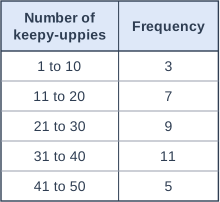
Some pupils counted how many keepy-uppies they could do with a football without dropping it. The table shows the results for 35 pupils.

Which class contains the median?

Table with columns "Number of keepy-uppies", "Frequency". Number of keepy-uppies: 1 to 10; Frequency: 3 | Number of keepy-uppies: 11 to 20; Frequency: 7 | Number of keepy-uppies: 21 to 30; Frequency: 9 | Number of keepy-uppies: 31 to 40; Frequency: 11 | Number of keepy-uppies: 41 to 50; Frequency: 5.

Model answer

Median position = \(\dfrac{35 + 1}{2} = 18\)th value
Running totals: 3, 10, 19
The 11th to 19th values are in the class 21 to 30.
The median is in the class 21 to 30.

Explanation

With 35 values, the median is the 18th. Add up the frequencies as you go down the table: 3, then 10, then 19. The 18th value comes after the first 10 and by the 19th, so it is in the class 21 to 30. A common mistake is to give the modal class, 31 to 40, instead.

Mark scheme
  1. 1 mark

    The median is the 18th value (\(\dfrac{35 + 1}{2} = 18\)), or running totals 3, 10, 19; or the correct answer 21 to 30 with no working

  2. 1 mark

    21 to 30

    Do not accept 31 to 40 (the modal class) or 18 (the position). A correct answer with no working scores full marks.

Question 3

3 marks

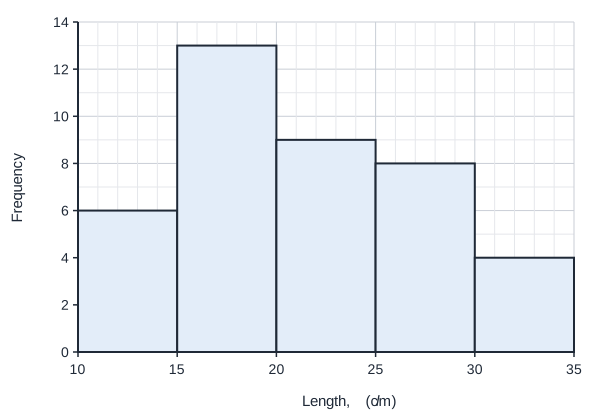
Nadia grew some runner beans. The frequency diagram shows the lengths, \(l\) cm, of the beans she picked. The classes are \(10 \le l < 15\), \(15 \le l < 20\), and so on.

Which class contains the median length?

A frequency diagram on a grid. The horizontal axis is "Length, l (cm)", numbered every 5 from 10 to 35. The vertical axis is "Frequency", numbered every 2 from 0 to 14, with a grid line every 1. There are 5 bars with no gaps between them: from 10 to 15 it reaches 6, from 15 to 20 it reaches 13, from 20 to 25 it reaches 9, from 25 to 30 it reaches 8 and from 30 to 35 it reaches 4.

Model answer

Total = \(6 + 13 + 9 + 8 + 4 = 40\) beans
The median is halfway between the 20th and 21st values.
Running totals: 6, 19, 28
The 20th to 28th beans are in \(20 \le l < 25\).
The median is in the class \(20 \le l < 25\).

Explanation

First find how many beans there are by adding the bar heights: 40. The median is halfway between the 20th and 21st lengths. The running totals 6, 19, 28 show that the first 19 beans are shorter than 20 cm and the 20th to 28th are in \(20 \le l < 25\), so both middle values are in that class. A common mistake is to give the class with the tallest bar.

Mark scheme
  1. 1 mark

    Total number of beans \(6 + 13 + 9 + 8 + 4 = 40\); or the correct answer \(20 \le l < 25\) with no working

  2. 1 mark

    The median is halfway between the 20th and 21st values (or is the 20.5th value), e.g. with running totals 6, 19, 28

  3. 1 mark

    \(20 \le l < 25\)

    Accept the class typed in any clear way, e.g. 20 <= l < 25 or 20 to 25. Do not accept \(15 \le l < 20\) (the modal class) or 20.5 (the position). A correct answer with no working scores full marks.

Question 4

4 marks

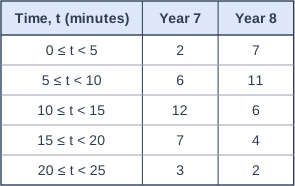
At a puzzle club, 30 Year 7 pupils and 30 Year 8 pupils each did the same puzzle. The table shows how long, \(t\) minutes, they took.

Write down the modal class for each year group. Then find the class that contains the median for each year group.

Use your answers to compare the times of the two year groups.

Table with columns "Time, t (minutes)", "Year 7", "Year 8". Time, t (minutes): 0 ≤ t < 5; Year 7: 2; Year 8: 7 | Time, t (minutes): 5 ≤ t < 10; Year 7: 6; Year 8: 11 | Time, t (minutes): 10 ≤ t < 15; Year 7: 12; Year 8: 6 | Time, t (minutes): 15 ≤ t < 20; Year 7: 7; Year 8: 4 | Time, t (minutes): 20 ≤ t < 25; Year 7: 3; Year 8: 2.

Model answer

Year 7: highest frequency 12, so the modal class is \(10 \le t < 15\).
Year 8: highest frequency 11, so the modal class is \(5 \le t < 10\).
Median: halfway between the 15th and 16th values.
Year 7 running totals: 2, 8, 20, so the median is in \(10 \le t < 15\).
Year 8 running totals: 7, 18, so the median is in \(5 \le t < 10\).
The Year 8 pupils were generally quicker, because their modal class and median class are lower.

Explanation

Work with each year group's column on its own. The modal class has the highest frequency, and with 30 pupils the median is halfway between the 15th and 16th values, which the running totals locate. Both of Year 8's classes are lower, so they typically took less time. When you compare, say what the numbers mean: lower times mean quicker pupils.

Mark scheme
  1. 1 mark

    Both modal classes: Year 7 \(10 \le t < 15\) and Year 8 \(5 \le t < 10\) (correct with no working scores this mark)

  2. 1 mark

    The median is halfway between the 15th and 16th values (or is the 15.5th value), or running totals for either year group, e.g. 2, 8, 20 or 7, 18

  3. 1 mark

    Both median classes: Year 7 \(10 \le t < 15\) and Year 8 \(5 \le t < 10\)

  4. 1 mark

    A correct comparison in context, e.g. "The Year 8 pupils were generally quicker (took less time) than the Year 7 pupils, because their modal class and median class are lower."

    Classes may be typed in any clear way, e.g. 5 <= t < 10 or 5 to 10. Follow through their classes. "Year 8 is lower" with no mention of the time taken or speed scores 0. Correct classes with no working score the first three marks; the last mark needs the comparison.

Ready to try the rest? Every answer you write is marked against the mark scheme, so you can see exactly where the marks are.

Topic notes

Grouped data

The big idea

When data has lots of different values, a table with a row for each value would be far too long. Instead, the values are sorted into groups called classes, in a grouped frequency table. This makes the data quick to read and draw, but you lose the exact values.

In Year 7 you met discrete data, which is counted (such as goals), and continuous data, which is measured (such as a time). You also wrote groups with inequalities, such as \(4 < x \le 8\).

Classes

  • Discrete data uses classes such as 1 to 10, 11 to 20 and 21 to 30.
  • Continuous data uses inequalities. \(10 \le t < 20\) means \(t\) is at least 10 ("\(\le\)": less than or equal to) and less than 20 ("\(<\)": less than).
  • So a time of exactly 20 seconds goes in the next class, \(20 \le t < 30\).
  • Good classes have no gaps and no overlaps, so every value fits in exactly one class.

The modal class and the median class

The modal class is the class with the highest frequency. The median is still the \(\dfrac{n + 1}{2}\)th value, and running totals show which class it is in: the class containing the median.

The table shows the lengths, \(l\) cm, of the 45 fish caught in a competition. Kai says, "The median length is in \(40 \le l < 50\), because that class has the most fish." Is he right?

Length, \(l\) (cm)FrequencyRunning total
\(10 \le l < 20\)44
\(20 \le l < 30\)913
\(30 \le l < 40\)1326
\(40 \le l < 50\)1541
\(50 \le l < 60\)445

The class with the most fish, 15, is the modal class, \(40 \le l < 50\).

The median is the \(\dfrac{45 + 1}{2} = 23\)rd length. The running totals show that the 14th to 26th fish are in \(30 \le l < 40\), so this class contains the median.

So Kai is wrong: he has found the modal class.

Charts for grouped data

  • For grouped discrete data, draw a bar chart: one bar for each class, with gaps between the bars.
  • For continuous data, draw a frequency diagram. The bars touch, because the data has no gaps, and the horizontal axis is a number scale with the class boundaries (10, 20, 30, ...) marked on it.

In both, the height of a bar is the frequency of its class.

The bar chart shows how many skips 36 pupils did in one minute. How many pupils did from 21 to 60 skips? Can you tell how many did more than 50?

Bar chart of number of pupils for each number of skips in one minute: 1 to 20 2, 21 to 40 7, 41 to 60 12, 61 to 80 10, 81 to 100 5.
Skips are counted (discrete data), so the bars have gaps.

From 21 to 60 skips means the classes 21 to 40 and 41 to 60: \(7 + 12 = 19\) pupils.

No: 12 pupils did from 41 to 60 skips, but the chart does not show how many of them did more than 50.

What grouped data cannot tell you

A grouped table shows how many values are in each class, but not the values themselves. So you can find the modal class and the class containing the median, but not the exact mean (you cannot add up values you do not know) or the exact range (you do not know the smallest and largest values).

For the fish, \(60 - 10 = 50\) cm is not the range: 10 and 60 are the ends of classes, not real lengths.

Stretch: estimating the range

You can still find limits for the range.

Could the range of the fish lengths be 25 cm? Could it be 45 cm?

The shortest fish is at least 10 cm but less than 20 cm. The longest is at least 50 cm but less than 60 cm.

Greatest possible range: the longest as long as possible and the shortest as short as possible, so the range is less than \(60 - 10 = 50\) cm.

Smallest possible range: the longest as short as possible and the shortest as long as possible, so the range is more than \(50 - 20 = 30\) cm.

So the range is between 30 cm and 50 cm: it could be 45 cm, but not 25 cm.

Remember

  • \(10 \le t < 20\) includes 10 but not 20.
  • The modal class has the highest frequency.
  • Running totals show which class contains the median.
  • You cannot find the exact mean or range from grouped data.

Common mistakes

  • Giving the frequency, 15, instead of the modal class, \(40 \le l < 50\).
  • Giving the modal class when asked for the class containing the median: use running totals.
  • Putting a boundary value in the class below: 20 cm goes in \(20 \le l < 30\).
  • Using only one class for "shorter than 30 cm": include every class below 30.

Top tip

Write the running totals next to the table. The last one should match the total number of values.

Study Helper Hints first, answers after you try

Stuck on this one? Ask for a hint and I’ll point you in the right direction, without giving the answer away. Once you’ve checked your answer, I’ll show you how the marks are awarded.