Level:
Correct: 0
Incorrect: 0
Marks: 0/0
Practice
Course:
Topics:
Year 8 Maths Smart practice A mixed round aimed at your weak spots
Unit 1
Number: accuracy, powers and standard form
Unit 2
Fractions, decimals and percentages
Unit 3
Algebraic expressions
Unit 4
Equations, inequalities and formulae
Unit 5
Sequences and graphs
Unit 6
Ratio, proportion and rates of change
Unit 7
Circles, area and volume
Unit 8
Angles and constructions
Unit 9
Transformations and symmetry
Unit 10
Probability
Unit 11
Statistics
Avg
score:
–
Topics
done:
0/50

Averages from frequency tables

Practise 25 questions on Averages from frequency tables for Year 8 Maths. Write your answer and get it marked in seconds against the mark scheme, point by point, with the Study Helper on hand if you get stuck.

  • 25 questions
  • 1–5 marks each
  • Instant marking
  • No sign-up needed
20 questions, marked as you go

Sample questions with model answers

Here are 4 of the questions in this topic, each with a model answer, an explanation of why it earns the marks and the mark scheme.

Question 1

1 mark

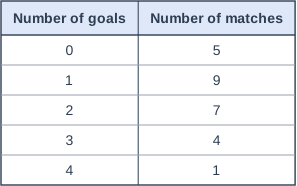
The table shows the number of goals the school football team scored in each match last season.

How many goals did the team score altogether in the matches where it scored 3 goals?

Table with columns "Number of goals", "Number of matches". Number of goals: 0; Number of matches: 5 | Number of goals: 1; Number of matches: 9 | Number of goals: 2; Number of matches: 7 | Number of goals: 3; Number of matches: 4 | Number of goals: 4; Number of matches: 1.

Model answer

The team scored 3 goals in each of 4 matches.
\(3 \times 4 = 12\) goals

Explanation

The row for 3 goals has frequency 4, so the team scored 3 goals in each of 4 matches. That is \(3 \times 4 = 12\) goals. Multiplying each value by its frequency like this is the first step in finding the total, and then the mean, from a frequency table. A common mistake is to give the frequency, 4, as the answer.

Mark scheme
  1. 1 mark

    12 (goals)

    Do not accept 4 (the number of matches) or 7 (\(3 + 4\)). A correct answer with no working scores full marks.

Question 2

2 marks

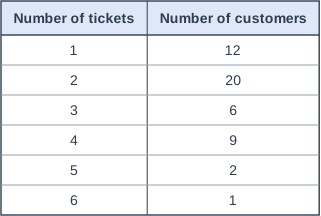
A cinema recorded how many tickets each customer bought one evening. The table shows the results.

Work out the total number of tickets the cinema sold that evening.

Table with columns "Number of tickets", "Number of customers". Number of tickets: 1; Number of customers: 12 | Number of tickets: 2; Number of customers: 20 | Number of tickets: 3; Number of customers: 6 | Number of tickets: 4; Number of customers: 9 | Number of tickets: 5; Number of customers: 2 | Number of tickets: 6; Number of customers: 1.

Model answer

\(1 \times 12 = 12\)
\(2 \times 20 = 40\)
\(3 \times 6 = 18\)
\(4 \times 9 = 36\)
\(5 \times 2 = 10\)
\(6 \times 1 = 6\)
Total = \(12 + 40 + 18 + 36 + 10 + 6 = 122\) tickets

Explanation

Each row tells you how many customers bought that number of tickets. For example, 20 customers bought 2 tickets each, which is 40 tickets. Multiply across every row and add the results to get the total. A common mistake is to add the frequencies, which gives the number of customers, 50, not the number of tickets.

Mark scheme
  1. 1 mark

    At least four of the products \(1 \times 12\), \(2 \times 20\), \(3 \times 6\), \(4 \times 9\), \(5 \times 2\), \(6 \times 1\) correct (12, 40, 18, 36, 10, 6); or the correct answer 122 with no working

  2. 1 mark

    122 (tickets)

    Do not accept 50 (the number of customers) or 21 (\(1 + 2 + 3 + 4 + 5 + 6\)). A correct answer with no working scores full marks.

Question 3

3 marks

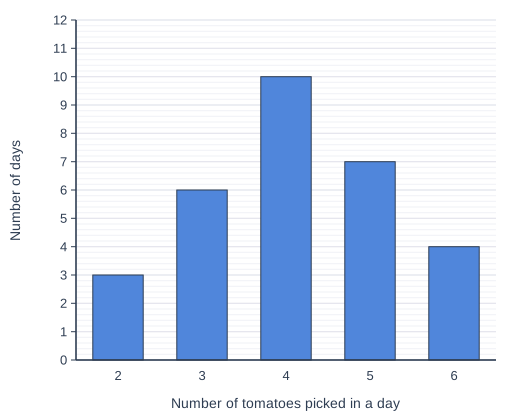
Femi grows tomatoes. The bar chart shows how many ripe tomatoes she picked each day in June. June has 30 days.

Work out the mean number of tomatoes Femi picked per day.

Bar chart of number of days for each number of tomatoes picked in a day: 2 3, 3 6, 4 10, 5 7, 6 4.

Model answer

Total = \(2 \times 3 + 3 \times 6 + 4 \times 10 + 5 \times 7 + 6 \times 4\)
= \(6 + 18 + 40 + 35 + 24 = 123\) tomatoes
Number of days = \(3 + 6 + 10 + 7 + 4 = 30\)
Mean = \(123 \div 30 = 4.1\) tomatoes

Explanation

Each bar shows how many days Femi picked that number of tomatoes, so the bars give the frequencies. Multiply each number of tomatoes by its frequency and add to find the total, 123 tomatoes. Divide by the 30 days to get 4.1 tomatoes per day. A common mistake is to divide by 5, the number of bars.

Mark scheme
  1. 1 mark

    Total number of tomatoes: \(2 \times 3 + 3 \times 6 + 4 \times 10 + 5 \times 7 + 6 \times 4 = 123\); or the correct answer 4.1 with no working

    Allow one reading or multiplying error for this mark.

  2. 1 mark

    Their total divided by 30 (the number of days)

    Award for \(123 \div 30\), or for their total \(\div 30\).

  3. 1 mark

    4.1

    Accept \(4\dfrac{1}{10}\). Do not accept 24.6 (\(123 \div 5\)) or 4 (the mean of 2 to 6). A correct answer with no working scores full marks.

Question 4

4 marks

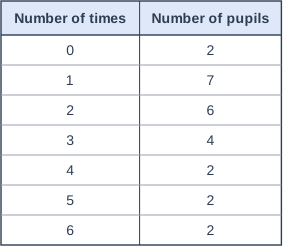
The table shows how many times each of 25 pupils went swimming over the summer holiday.

Ava says, "The mean is bigger than the median."

Is Ava right? Show how you know.

Table with columns "Number of times", "Number of pupils". Number of times: 0; Number of pupils: 2 | Number of times: 1; Number of pupils: 7 | Number of times: 2; Number of pupils: 6 | Number of times: 3; Number of pupils: 4 | Number of times: 4; Number of pupils: 2 | Number of times: 5; Number of pupils: 2 | Number of times: 6; Number of pupils: 2.

Model answer

Total = \(0 + 7 + 12 + 12 + 8 + 10 + 12 = 61\) swims
Mean = \(61 \div 25 = 2.44\)
Median = 13th value. Running totals: 2, 9, 15, so the 13th value is 2.
2.44 is bigger than 2, so Ava is right.

Explanation

Work out both averages. The mean is the total, 61 swims, divided by 25 pupils, which is 2.44. The median is the 13th value: the running totals 2, 9, 15 show that the 10th to 15th pupils went swimming 2 times. The few pupils who went 5 or 6 times pull the mean up, but they hardly change the median. A common mistake is to take the median from the middle row of the table.

Mark scheme
  1. 1 mark

    Total number of swims: \(0 \times 2 + 1 \times 7 + 2 \times 6 + 3 \times 4 + 4 \times 2 + 5 \times 2 + 6 \times 2 = 61\)

    Allow one multiplying or adding error for this mark.

  2. 1 mark

    Mean = \(61 \div 25 = 2.44\)

    Follow through their total \(\div 25\).

  3. 1 mark

    Median = 2 (the 13th value)

    Do not accept 3 (the middle row of the table).

  4. 1 mark

    Yes (Ava is right), because the mean, 2.44, is bigger than the median, 2

    Needs a mean and a median worked out; follow through their values if the decision matches them. "Yes" on its own scores 0. A complete correct reason on its own scores all four marks: both averages worked out and compared.

Ready to try the rest? Every answer you write is marked against the mark scheme, so you can see exactly where the marks are.

Topic notes

Averages from frequency tables

The big idea

A frequency table sums up a lot of data in a few rows. Each row gives a value and its frequency: how many times it comes up. You can find averages straight from it.

In Year 7 you found the mode (most common value), median (middle value, in order), mean (total divided by the number of values) and range (largest minus smallest) of a list.

The mode, the range and the mean

  • Add up the frequencies to get the total frequency: the number of values.
  • The mode is the value with the highest frequency. For the range, ignore any row with a frequency of 0.
  • For the mean, multiply each value, \(x\), by its frequency, \(f\), in an extra column (the fx column). This column adds up to the total of all the values. Divide that by the total frequency.

The table shows how many pets each pupil in a class has. Find the mode, the range and the mean.

Number of pets, \(x\)Number of pupils, \(f\)\(x \times f\)
040
177
2510
339
414
500
Total2030

Mode: the highest frequency is 7, for 1 pet, so the mode is 1 pet.

Range: nobody has 5 pets, so that row is not part of the data. Range \(= 4 - 0 = 4\) pets.

Mean: 20 pupils have 30 pets, so the mean is \(30 \div 20 = 1.5\) pets. The 4 pupils with no pets still count when you divide.

The median

A frequency table already has the values in order. With \(n\) values, the median is the \(\dfrac{n + 1}{2}\)th value. A running total of the frequencies shows which row it is in.

A bird club counted the eggs in each of 26 nest boxes. Find the median number of eggs.

Number of eggsNumber of nest boxesRunning total
044
137
2613
3821
4324
5226

The median is the \(\dfrac{26 + 1}{2} = 13.5\)th value, halfway between the 13th and 14th. The running totals show that the 13th value is the last 2, and the 14th is the first 3. So the median is 2.5 eggs.

With 27 values, the median would be the 14th.

Comparing two frequency tables

Work out an average and the range for each table. Then write a sentence about each, in context.

At mini golf, Priya played 18 holes and Tom played 12. The table shows how many shots they took at each hole. Compare their scores.

Number of shotsPriya (holes)Tom (holes)
122
283
353
432
501
601

Priya: total \(= 2 + 16 + 15 + 12 = 45\) shots, mean \(= 45 \div 18 = 2.5\) shots, range \(= 4 - 1 = 3\) shots.

Tom: total \(= 2 + 6 + 9 + 8 + 5 + 6 = 36\) shots, mean \(= 36 \div 12 = 3\) shots, range \(= 6 - 1 = 5\) shots.

Tom took fewer shots in total, but he played fewer holes, so compare the means. In golf fewer shots is better, so Priya played better on average. Her range is smaller, so her scores were more consistent.

Stretch: a missing frequency

The total of the values is the mean times the total frequency, so the total frequency is the total ÷ the mean. (For a gap in another row, use a letter and an equation.)

A running club recorded how many runs each member went on last week. The mean is 2 runs. How many members went on no runs?

Number of runsNumber of members
0\(n\)
14
28
36
44

Members with no runs add nothing to the total: \(4 + 16 + 18 + 16 = 54\) runs.

The mean is 2, so there are \(54 \div 2 = 27\) members. The table shows \(4 + 8 + 6 + 4 = 22\), so \(n = 27 - 22 = 5\).

Remember

  • Mean = total of the fx column \(\div\) total frequency.
  • The median is the \(\dfrac{n + 1}{2}\)th value: use running totals to find it.
  • The mode is a value from the table, never a frequency.

Common mistakes

  • Dividing by the number of rows (\(30 \div 6 = 5\) pets) instead of the total frequency, 20.
  • Giving the frequency, 7, as the mode instead of its value, 1 pet.
  • Giving the position as the median (13.5 instead of 2.5 eggs), or choosing the middle row of the table.
  • Using a row with a frequency of 0 for the range: for the pets it is \(4 - 0\), not \(5 - 0\).

Top tip

Your mean and median must lie between the smallest and largest values: a mean of 5 pets, when nobody has more than 4, is wrong.

Study Helper Hints first, answers after you try

Stuck on this one? Ask for a hint and I’ll point you in the right direction, without giving the answer away. Once you’ve checked your answer, I’ll show you how the marks are awarded.