Level:
Correct: 0
Incorrect: 0
Marks: 0/0
Practice
Course:
Topics:
Year 8 Maths Smart practice A mixed round aimed at your weak spots
Unit 1
Number: accuracy, powers and standard form
Unit 2
Fractions, decimals and percentages
Unit 3
Algebraic expressions
Unit 4
Equations, inequalities and formulae
Unit 5
Sequences and graphs
Unit 6
Ratio, proportion and rates of change
Unit 7
Circles, area and volume
Unit 8
Angles and constructions
Unit 9
Transformations and symmetry
Unit 10
Probability
Unit 11
Statistics
Avg
score:
–
Topics
done:
0/50

Real-life graphs

Practise 25 questions on Real-life graphs for Year 8 Maths. Write your answer and get it marked in seconds against the mark scheme, point by point, with the Study Helper on hand if you get stuck.

  • 25 questions
  • 1–5 marks each
  • Instant marking
  • No sign-up needed
20 questions, marked as you go

Sample questions with model answers

Here are 4 of the questions in this topic, each with a model answer, an explanation of why it earns the marks and the mark scheme.

Question 1

1 mark

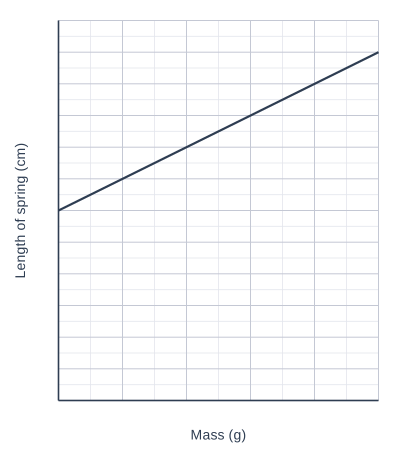
In a science lesson, Maya hangs masses on a spring and measures the length of the spring. The graph shows her results.

Use the graph to find the length of the spring when the mass is 300 g.

A graph of Length of spring (cm) (vertical axis, 0 to 24, marked every 2) against Mass (g) (horizontal axis, 0 to 500, marked every 100), on a grid with 2 small squares to each large square. The graph is a straight line; its values can be read from the grid.

Model answer

Go up from 300 g to the line, then across to the length axis.
The length is 18 cm.

Explanation

Find 300 on the mass axis, go up to the line, then across to read the length: 18 cm (each small square on the length axis is 1 cm). The line starts at 12 cm, the length of the spring with no mass on it, so the length is not in direct proportion to the mass. A common mistake is to read across from the wrong axis.

Mark scheme
  1. 1 mark

    18 cm

    Accept 18 or answers from 17.5 to 18.5. Do not accept 6 (the stretch only) or 300. A correct answer with no working scores full marks.

Question 2

2 marks

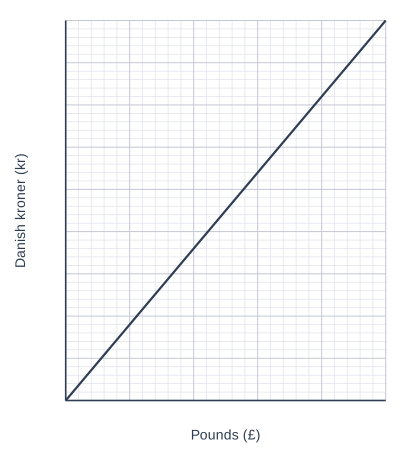
Here is a conversion graph for pounds (£) and Danish kroner (kr).

Is one krone worth more than 10p or less than 10p? Use the graph to explain how you know.

A graph of Danish kroner (kr) (vertical axis, 0 to 450, marked every 50) against Pounds (£) (horizontal axis, 0 to 50, marked every 10), on a grid with 5 small squares to each large square. The graph is a straight line; its values can be read from the grid.

Model answer

From the graph, £10 = 90 kr.
If 1 krone were worth 10p, 90 kr would be worth 900p = £9.
But 90 kr is worth £10, so each krone is worth more than 10p (about 11p).

Explanation

Read one pair of values from the graph, such as £10 = 90 kr. If a krone were worth exactly 10p, you would get 100 kr for £10. You get fewer kroner than that, so each krone must be worth more than 10p: \(1000\text{p} \div 90 \approx 11\)p. A common mistake is to think more kroner per pound means each krone is worth more; it is the other way round.

Mark scheme
  1. 1 mark

    More than 10p, with a relevant but incomplete reason, e.g. 'you get fewer than 100 kr for £10'

    'More' on its own scores 0.

  2. 1 mark

    A complete correct reason using a reading from the graph, e.g. £10 = 90 kr, so 1 kr is worth \(1000 \div 90 \approx 11\)p / if 1 kr were 10p, £10 would buy 100 kr, but the graph shows only 90 kr / £50 = 450 kr, and 450 kr at 10p each would be only £45

    A complete correct reason on its own scores both marks.

Question 3

3 marks

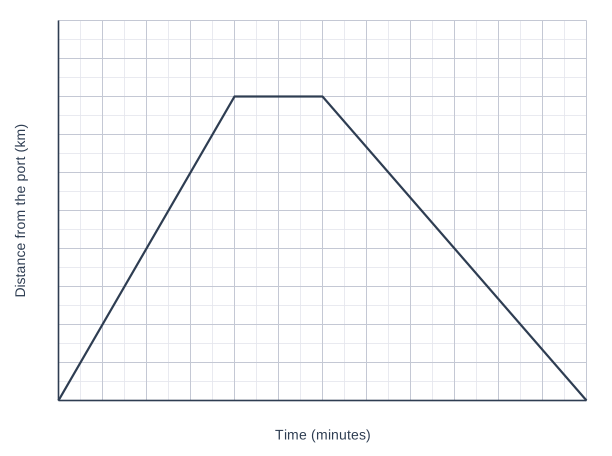
A ferry sails from a port to an island. It waits at the island and then sails back to the port.

The graph shows the ferry's distance from the port.

Work out the speed of the ferry on the way to the island and on the way back, in km/h. How much faster was the ferry on the way to the island?

A graph of Distance from the port (km) (vertical axis, 0 to 20, marked every 2) against Time (minutes) (horizontal axis, 0 to 120, marked every 10), on a grid with 2 small squares to each large square. The graph is made of straight-line sections; its values can be read from the grid.

Model answer

To the island: 16 km in 40 minutes. 40 minutes is \(\dfrac{2}{3}\) of an hour, so in 1 hour it would go \(16 \div 2 \times 3 = 24\) km. Speed 24 km/h.
Back: 16 km in 60 minutes (from 60 to 120 minutes). Speed 16 km/h.
\(24 - 16 = 8\)
The ferry was 8 km/h faster on the way to the island.

Explanation

Read the distance and the time for each moving part. The time is in minutes, so change it to hours (or scale up to 60 minutes): 16 km in 40 minutes is the same as 24 km in 60 minutes, so 24 km/h. The way back takes a full hour for 16 km, so 16 km/h. The steeper line is the faster part. A common mistake is to divide 16 by 40 and give 0.4 as the speed in km/h.

Mark scheme
  1. 1 mark

    On the way to the island: 24 km/h

    From 16 km in 40 minutes: 16 km in \(\dfrac{2}{3}\) hour, or 8 km in 20 minutes, so 24 km in 60 minutes. Do not accept 0.4 (km per minute) without changing to km/h.

  2. 1 mark

    On the way back: 16 km/h

    From 16 km in 60 minutes.

  3. 1 mark

    8 km/h faster

    Follow through their two speeds. A correct answer with no working scores full marks.

Question 4

4 marks

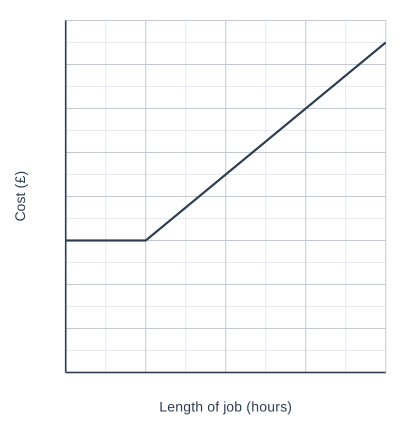
Here is a graph of a plumber's charges for jobs of up to 4 hours.

Explain what the flat part of the graph shows.

After the flat part, the cost goes up at the same rate. A job costs £165. How long did the job take? Show how you work it out.

A graph of Cost (£) (vertical axis, 0 to 160, marked every 20) against Length of job (hours) (horizontal axis, 0 to 4, marked every 1), on a grid with 2 small squares to each large square. The graph is made of straight-line sections; its values can be read from the grid.

Model answer

The flat part: any job up to 1 hour costs £60.
After 1 hour, the cost goes up from £60 to £150 in 3 hours: \(90 \div 3 = 30\), so £30 an hour.
\(165 - 60 = 105\) pounds, and \(105 \div 30 = 3.5\) extra hours.
The job took \(1 + 3.5 = 4.5\) hours.

Explanation

A flat section means the cost does not change as the time goes up: every job up to 1 hour costs £60. After that, the gradient shows the extra cost: £90 over 3 hours, which is £30 an hour. £165 is £105 more than £60, which pays for 3.5 extra hours, so the job took 4.5 hours in total. You can check by carrying the graph on: 4 hours costs £150, and half an hour more adds £15. A common mistake is to forget the first hour and answer 3.5 hours.

Mark scheme
  1. 1 mark

    The flat part shows that every job up to 1 hour costs the same, £60 (a minimum charge)

    Accept 'you pay £60 even for a short job' or 'the first hour costs £60'. Do not accept 'the plumber is not working'.

  2. 1 mark

    £30 for each hour after the first hour

    From \((150 - 60) \div 3\), or £30 from 1 to 2 hours.

  3. 1 mark

    A correct method for £165, e.g. \((165 - 60) \div 30 = 3.5\) extra hours / continues the graph: 4 hours £150, so £15 more is half an hour

    Follow through their rate.

  4. 1 mark

    4.5 hours (4 hours 30 minutes)

    Do not accept 3.5 hours (the extra time only) or 5.5 hours. The question asks for working, so 4.5 hours with no working scores this mark only. A complete correct explanation of the flat part on its own scores the first mark.

Ready to try the rest? Every answer you write is marked against the mark scheme, so you can see exactly where the marks are.

Topic notes

Real-life graphs

The big idea

Real-life graphs show how one quantity changes with another, such as distance with time or cost with hours. To read one, check what each axis stands for, then think about what a steep, flat or falling piece means. The gradient often gives a rate, such as a speed or a price per hour.

In Year 7 you used conversion graphs: start on the axis of the unit you have, go to the line, then across or down to the other axis.

Proportion and fixed charges

  • A straight line through the origin, \((0, 0)\), shows direct proportion: double one quantity and the other doubles too. Most conversion graphs are like this (but not °C to °F), so you can scale up a reading beyond the graph. If 5 miles is about 8 km, then 50 miles is about 80 km.
  • A straight line that starts higher up the cost axis shows a fixed charge plus the same amount for each unit. This is not direct proportion. The fixed charge is where the line meets the cost axis, and the amount for each unit is the gradient.
A graph of Cost (£) (vertical axis, 0 to 32, marked every 4) against Hire time (hours) (horizontal axis, 0 to 6, marked every 1), on a grid with 4 small squares to each large square. The graph labelled "Shop A" is a straight line joining (0, 0) and (6, 30). The graph labelled "Shop B" is a straight line joining (0, 8) and (6, 26). The graph labelled "Shop A" and the graph labelled "Shop B" cross at (4, 20). A dot at (4, 20) is labelled "(4, 20)".
The cost of hiring a canoe from two shops. The lines cross at 4 hours, where both shops charge £20.

Canoe hire

(a) What is Shop B's fixed charge, and how much does it charge for each hour? (b) Ben hires from Shop B for 10 hours, off the graph. He says, "5 hours costs £23, so 10 hours costs £46." Is he right? (c) Which shop's cost is directly proportional to the time?

(a) Shop B's line meets the cost axis at £8: that is the fixed charge. Its cost rises from £8 to £26 in 6 hours, and \(18 \div 6 = 3\), so it charges £3 an hour.

(b) No. Doubling only works for direct proportion, and Ben has counted the £8 fixed charge twice. 10 hours costs \(8 + 10 \times 3 = 38\) pounds.

(c) Shop A: its line is straight and passes through \((0, 0)\). It charges £5 an hour.

Distance-time graphs

A distance-time graph shows how far something is from a starting point as time goes on.

  • Speed = distance ÷ time, which is the gradient. The steeper the line, the faster.
  • A flat piece means a stop: the distance is not changing.
  • A line going down means travelling back towards the start, not going downhill.
  • A graph made of several straight pieces is a piece-wise graph. Describe it one piece at a time.
A graph of Distance from home (km) (vertical axis, 0 to 8, marked every 1) against Time (minutes) (horizontal axis, 0 to 80, marked every 10), on a grid with 2 small squares to each large square. The graph is made of straight-line sections joining (0, 0), (15, 6), (45, 6) and (75, 0). A dashed straight line segment joins (0, 4) to (55, 4). A dashed straight line segment joins (10, 4) to (10, 0). A dashed straight line segment joins (55, 4) to (55, 0).
Priya's bike ride: her distance from home over time. The dashed lines show when she was 4 km from home.

Describe Priya's ride. When was she 4 km from home?

0 to 15 minutes: she rides 6 km away from home. 15 minutes is a quarter of an hour, so her speed is \(6 \times 4 = 24\) km/h.

15 to 45 minutes: the line is flat, so she stops for 30 minutes, 6 km from home.

45 to 75 minutes: she rides 6 km back home. The line is less steep, so she is slower than on the way out.

Go across from 4 km: the line is there twice, at 10 minutes (going out) and 55 minutes (coming back).

Filling containers

When water flows into a container at a steady rate:

  • where the container is wide, the depth rises slowly (a gentle graph); where it is narrow, the depth rises quickly (a steep graph);
  • straight upright sides give a straight line; sloping or curved sides give a curve.

A round fish bowl is narrow at the bottom, widest in the middle and narrower near the top. Describe the graph of the depth of water against time.

At the bottom the bowl is narrow, so the depth rises quickly: the graph starts steep.

Towards the middle the bowl gets wider, so the depth rises more and more slowly, least steeply at the widest part.

Above the middle the bowl narrows again, so the graph gets steeper again.

The sides are curved, so the graph is a smooth curve, not straight pieces.

Remember

  • A straight line through \((0, 0)\) shows direct proportion. A line starting higher up shows a fixed charge.
  • On a distance-time graph, the gradient is the speed and a flat piece is a stop.
  • In a container, wide means a slow rise and narrow means a fast rise.

Common mistakes

  • Dividing the whole cost by the time: take off the fixed charge first (\(18 \div 6\), not \(26 \div 6\)).
  • Thinking any straight line shows direct proportion. It must pass through \((0, 0)\).
  • Reading a line going down on a distance-time graph as going downhill. It means coming back.
  • Giving the highest point as the total distance. There and back is double.
  • Mixing up time: 1.5 hours is 1 hour 30 minutes, not 1 hour 50 minutes.

Top tip

Before you read a graph, read both axis labels and work out what one small square is worth. Readings between grid lines are estimates, so check that they are sensible.

Study Helper Hints first, answers after you try

Stuck on this one? Ask for a hint and I’ll point you in the right direction, without giving the answer away. Once you’ve checked your answer, I’ll show you how the marks are awarded.