Level:
Correct: 0
Incorrect: 0
Marks: 0/0

The effect of lifestyle on some non-communicable diseases

Practise 17 exam-style questions on The effect of lifestyle on some non-communicable diseases for AQA GCSE Combined Science (Biology Paper 1). Write your answer as you would in the exam and get it marked in seconds against the mark scheme, point by point, with the Study Helper on hand if you get stuck.

  • 17 questions
  • 1–6 marks each
  • Instant marking
  • No sign-up needed
17 questions, marked as you go

Sample questions with model answers

Here are 4 of the questions in this topic, each with a model answer, an explanation of why it earns the marks and the mark scheme an examiner would use.

Question 1

2 marks

Obesity is a risk factor for Type 2 diabetes.

Explain what this means.

Model answer

It means that obesity is linked to an increased rate of Type 2 diabetes: people who are obese are more likely to develop it than people who are not. It does not mean every obese person will develop Type 2 diabetes, or that people of a healthy weight cannot.

Explanation

Risk factors describe probabilities across a population, not certainties for an individual. Many diseases are caused by an interaction of several factors.

Mark scheme
  1. 1 mark

    obese people are more likely to develop Type 2 diabetes / obesity is linked to an increased rate of Type 2 diabetes

  2. 1 mark

    but not every obese person will develop Type 2 diabetes / people who are not obese can also develop it

Question 2

2 marks

For some risk factors, a causal mechanism has been proven. For example, smoking is known to cause lung cancer.

Explain what is meant by a causal mechanism.

Model answer

A causal mechanism means scientists understand how the risk factor actually causes the disease, rather than just observing that the two are correlated. For example, carcinogens in tobacco smoke are known to cause changes in lung cells that lead to cancer.

Explanation

A correlation shows that two things are linked; a causal mechanism explains how one causes the other. For some risk factors a causal mechanism has not yet been proven.

Mark scheme
  1. 1 mark

    scientists know how the risk factor causes the disease

    allow it has been shown that the factor directly causes the disease

  2. 1 mark

    e.g. carcinogens in tobacco smoke cause changes in lung cells that lead to cancer / not just a correlation

Question 3

3 marks

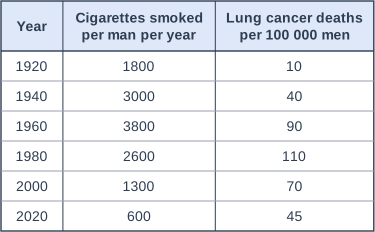
The table shows the mean number of cigarettes smoked per man each year and the death rate from lung cancer among men in one country between 1920 and 2020.

Describe how the lung cancer death rate changed compared with the number of cigarettes smoked.
Suggest why the death rate reached its peak later than cigarette smoking.

Table with columns "Year", "Cigarettes smoked per man per year", "Lung cancer deaths per 100 000 men". Year: 1920; Cigarettes smoked per man per year: 1800; Lung cancer deaths per 100 000 men: 10 | Year: 1940; Cigarettes smoked per man per year: 3000; Lung cancer deaths per 100 000 men: 40 | Year: 1960; Cigarettes smoked per man per year: 3800; Lung cancer deaths per 100 000 men: 90 | Year: 1980; Cigarettes smoked per man per year: 2600; Lung cancer deaths per 100 000 men: 110 | Year: 2000; Cigarettes smoked per man per year: 1300; Lung cancer deaths per 100 000 men: 70 | Year: 2020; Cigarettes smoked per man per year: 600; Lung cancer deaths per 100 000 men: 45.

Model answer

Both rose and then fell. Cigarette smoking increased to a peak of 3800 per man per year in 1960 and then decreased, while the lung cancer death rate increased to a peak of 110 per 100 000 men in 1980 before falling. The death rate peaked about 20 years after smoking did, because lung cancer takes many years to develop after a person is exposed to the carcinogens in tobacco smoke.

Explanation

A time lag between exposure to a risk factor and the disease is common for cancers. Data like these, together with a known causal mechanism, helped to show that smoking causes lung cancer.

Mark scheme
  1. 1 mark

    both increased and then decreased

    allow the death rate followed the same pattern as cigarette smoking

  2. 1 mark

    cigarette smoking peaked in 1960 but the death rate peaked in 1980 / about 20 years later

  3. 1 mark

    lung cancer takes many years to develop after exposure to the carcinogens in smoke

    allow there is a time lag between smoking and developing cancer

Question 4

4 marks

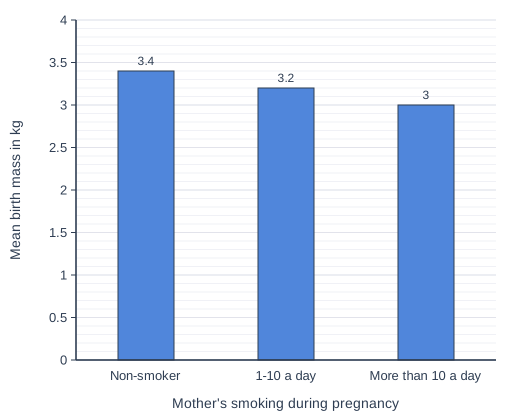
The bar chart shows the mean birth mass of babies born to mothers who smoked different numbers of cigarettes a day during pregnancy.

Calculate the percentage decrease in mean birth mass for babies of mothers who smoked more than 10 cigarettes a day compared with non-smokers. Give your answer to 2 significant figures.
Suggest how smoking during pregnancy reduces the birth mass of the baby.

Bar chart of mean birth mass in kg for each mother's smoking during pregnancy: Non-smoker 3.4, 1-10 a day 3.2, More than 10 a day 3.

Model answer

Percentage decrease = (3.4 − 3.0) ÷ 3.4 × 100 = 11.76...% = 12% (2 s.f.)
Carbon monoxide in cigarette smoke reduces the amount of oxygen the mother's blood can carry, so less oxygen reaches the foetus. With less oxygen for respiration, the foetus grows more slowly and is born smaller.

Explanation

The data show a dose-response pattern: the more the mother smoked, the lower the birth mass. Always divide the change by the original value (the non-smokers' mass) when calculating a percentage decrease.

Mark scheme
  1. 1 mark

    (3.4 − 3.0) ÷ 3.4 × 100

    an answer of 12 (%) scores the first 2 marks

  2. 1 mark

    12 (%)

    must be 2 significant figures

  3. 1 mark

    smoke (carbon monoxide) reduces the amount of oxygen carried by the mother's blood to the foetus

    allow harmful chemicals from smoke reach the foetus

  4. 1 mark

    so the foetus has less oxygen for respiration / grows less

Ready to try the rest? Every answer you write is marked against the mark scheme, so you can see exactly where the marks are.

Revision notes

The effect of lifestyle on some non-communicable diseases

The big idea

Many non-communicable diseases are linked to how people live: what they eat, whether they smoke, how much alcohol they drink and how active they are. These risk factors make a disease more likely but do not make it certain. You need to explain how each factor affects the body, use data to judge the links, and discuss the human and financial costs of these diseases.

Risk factors

A risk factor is linked to an increased rate of a disease. Risk factors can be:

  • aspects of a person's lifestyle, such as smoking, drinking alcohol, a diet high in fat or sugar, or lack of exercise;
  • substances in the body or environment, such as a high level of cholesterol in the blood, asbestos, or radon gas from rocks.

For some risk factors a causal mechanism has been proven: scientists know the biological process by which the factor causes the disease, as with smoking and lung cancer. For others there is only a correlation (a link in the data), which does not prove cause. Many diseases are caused by the interaction of a number of factors, such as a lifestyle factor and an inherited one, so not every smoker gets lung cancer and some non-smokers do.

How lifestyle factors cause disease

Risk factorDiseaseHow
Diet high in saturated fatCardiovascular diseaseRaises blood cholesterol, so fatty material builds up in the coronary arteries
SmokingCardiovascular diseaseCarbon monoxide combines with haemoglobin, so the blood carries less oxygen and the heart works harder; nicotine raises heart rate and blood pressure; chemicals damage the artery lining, so fatty material and clots form more easily
Lack of exerciseCardiovascular diseaseRegular exercise lowers blood pressure and cholesterol and helps prevent obesity
ObesityType 2 diabetesThe body cells stop responding properly to insulin, so blood glucose rises too high
AlcoholLiver diseaseAlcohol is toxic and is broken down in the liver; it damages liver cells, causing scarring (cirrhosis) and raising the risk of liver cancer
AlcoholBrain functionShort term: slows nerve impulses, giving slower reactions and poor judgement. Long term: brain damage and memory loss
SmokingLung disease and lung cancerTar contains carcinogens that cause mutations in lung cells, leading to uncontrolled cell division; smoking also causes emphysema and bronchitis
Smoking and alcohol in pregnancyHarm to the unborn babyCarbon monoxide means less oxygen reaches the foetus, so it grows more slowly (low birth weight); alcohol crosses the placenta and can damage the developing brain and organs
Carcinogens, including ionising radiationCancerDamage DNA, causing mutations; this is why X-ray staff stand behind a lead screen

Costs at different levels

LevelHuman costsFinancial costs
Individual and familyPain, poorer quality of life, early death; relatives become carersLost earnings; a carer may give up work
Local communityPressure on local doctors, hospitals and care servicesFewer people able to work locally
NationMany people ill or dying earlyThe health service pays for treatment; lost working days and less tax
GlobalMillions of deaths each year, rising in many countriesHuge total cost; poorer countries may not afford treatment

Changes in lifestyle change the incidence of these diseases at local, national and global levels. As incomes rise, more people eat high-energy diets and take less exercise, so Type 2 diabetes is rising worldwide. Cancers take many years to develop, so a fall in smoking is followed by a fall in lung cancer only after a time lag of decades.

Judging the evidence

Studies of risk factors need a large, random, representative sample, a comparison group without the risk factor, and control of other risk factors (for example, a study of radon and lung cancer must also record smoking).

Percentage increase

Hospital admissions linked to alcohol in one country rose from 0.6 million to 1.5 million a year. Calculate the percentage increase.

Increase: \(1.5 - 0.6 = 0.9\) million

\(\dfrac{0.9}{0.6} \times 100 = 150\%\). Divide the increase by the original value: \(\dfrac{1.5}{0.6} \times 100 = 250\%\) would be wrong.

Body mass index

\(\text{BMI} = \dfrac{\text{mass in kg}}{(\text{height in m})^2}\), and a BMI of 30 or more counts as obese. A woman has a mass of 78 kg and a height of 1.60 m.

\(1.60^2 = 2.56\), so \(\text{BMI} = \dfrac{78}{2.56} = 30.5\): she is classed as obese.

Common mistakes

  • Saying a risk factor "causes" the disease. It is linked to an increased rate of the disease.
  • Confusing carbon monoxide with carbon dioxide, or saying nicotine reduces oxygen. Carbon monoxide reduces the oxygen the blood carries.
  • Saying that in Type 2 diabetes the pancreas makes no insulin. That is Type 1; in Type 2 the cells stop responding to insulin.
  • Calling a correlation proof. Another factor could explain it, for example people who exercise a lot may also eat a healthier diet.
  • Forgetting to square the height in a BMI calculation.

Exam tip

In "discuss the costs" questions, give both human and financial costs, at more than one level (individual, community, nation, global). In "explain how smoking causes..." questions, name the substance (carbon monoxide, nicotine or tar) and say what it does in the body.

Study Helper Hints first, answers after you try

Stuck on this one? Ask for a hint and I’ll point you in the right direction, without giving the answer away. Once you’ve checked your answer, I’ll show you how the marks are awarded.