Practise 16 exam-style questions on Health issues for AQA GCSE Combined Science (Biology Paper 1). Write your answer as you would in the exam and get it marked in seconds against the mark scheme, point by point, with the Study Helper on hand if you get stuck.
16 questions
1–6 marks each
Instant marking
No sign-up needed
16 questions, marked as you go
Sample questions with model answers
Here are 4 of the questions in this topic, each with a model answer, an explanation of why it earns the marks and the mark scheme an examiner would use.
Question 1
2 marks
Apart from disease, other factors can have a profound effect on both physical and mental health.
Give two of these factors.
Model answer
Diet and stress. (Life situations, such as poverty or poor housing, are another factor.)
Explanation
A poor diet can lead to physical ill health, while stress and difficult life situations can affect both mental and physical health. Health depends on much more than avoiding pathogens.
Mark scheme
1 mark
diet
max 2
1 mark
stress
1 mark
life situations
allow a named life situation, e.g. poverty, poor housing, unemployment, relationship breakdown
Question 2
2 marks
Scientists comparing how common a disease is in different countries usually use the number of cases per 100 000 people, rather than the total number of cases.
Explain why.
Model answer
Countries have very different population sizes, so a large country could have more cases simply because it has more people. Using the number of cases per 100 000 people takes population size into account and allows a fair comparison.
Explanation
Translating total numbers into rates is a key skill when interpreting disease incidence data. A rate shows how common a disease is, not just how many cases there are.
Mark scheme
1 mark
the countries have different population sizes
1 mark
so a rate per 100 000 allows a fair comparison
allow a country with more people would have more cases even if the disease were no more common
Question 3
3 marks
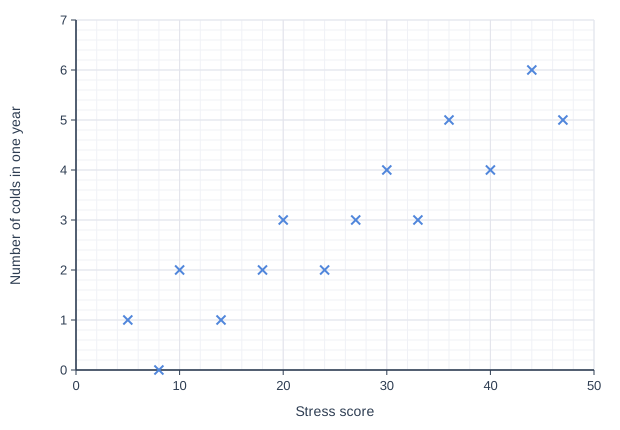
Researchers gave 14 adults a questionnaire to measure how stressed they were. They also recorded how many colds each person had in one year. The scatter diagram shows the results.
Describe the relationship shown. A newspaper said: "Stress causes colds." Explain whether the data prove this.
Model answer
There is a positive correlation: as the stress score increases, the number of colds tends to increase. However, this does not prove that stress causes colds. A correlation only shows that the two factors are linked; another factor, such as stressed people sleeping less or eating less healthily, could be the cause, and a sample of only 14 people is too small to draw a firm conclusion.
Explanation
Scatter diagrams can show a correlation between two variables, but a correlation is not proof of cause. A causal mechanism must be found, and larger samples are needed for confidence.
Mark scheme
1 mark
positive correlation: people with higher stress scores tended to have more colds
1 mark
a correlation does not prove that one factor causes the other
allow the data do not prove it
1 mark
another factor may be involved, e.g. stressed people may sleep less / eat poorly / or the sample of 14 people is too small
Question 4
4 marks
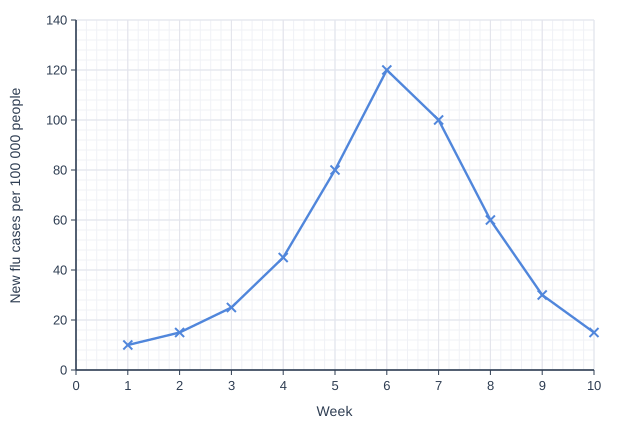
The graph shows the number of new cases of flu per 100 000 people each week during one winter. The data come from patients who visited their doctor.
Calculate the percentage increase in new cases from week 2 to week 6. Suggest why the real number of flu cases is probably higher than the graph shows.
Model answer
Week 2 = 15 cases per 100 000; week 6 = 120 cases per 100 000 Percentage increase = (120 − 15) ÷ 15 × 100 = 105 ÷ 15 × 100 = 700% The real number is probably higher because many people with flu stay at home and do not visit a doctor, so their cases are never recorded.
Explanation
Percentage increase = (new value − original value) ÷ original value × 100. Data from doctors' records only include people who seek medical help, so they underestimate how common a disease really is.
Mark scheme
1 mark
week 2 = 15 and week 6 = 120 (per 100 000)
an answer of 700 (%) scores the first 3 marks
1 mark
(120 − 15) ÷ 15 × 100
allow ecf from incorrect readings
1 mark
700 (%)
allow ecf
1 mark
many people with flu do not visit a doctor, so they are not recorded
allow the data are only a sample of cases
Ready to try the rest? Every answer you write is marked against the mark scheme, so you can see exactly where the marks are.
Ctrl + Enter to check
Study HelperHints first, answers after you try
Stuck on this one? Ask for a hint and I’ll point you in the right direction, without giving the answer away. Once you’ve checked your answer, I’ll show you how the marks are awarded.