Practise 21 questions on Scatter graphs and lines of best fit for Year 9 Maths. Write your answer and get it marked in seconds against the mark scheme, point by point, with the Study Helper on hand if you get stuck.
21 questions
1–5 marks each
Instant marking
No sign-up needed
20 questions, marked as you go
Sample questions with model answers
Here are 4 of the questions in this topic, each with a model answer, an explanation of why it earns the marks and the mark scheme.
Question 1
1 mark
Yusuf uses a line of best fit to estimate a value inside the range of his data.
What is this called?
Choose your answer.
interpolation
extrapolation
correlation
causation
Model answer
interpolation
Explanation
Interpolation means estimating a value inside the range of the data you have, so the estimate is backed up by points on either side. Extrapolation means going beyond the data, which is much less reliable because the pattern may not continue. One way to remember: 'inter' means between, as in 'international'.
Mark scheme
1 mark
interpolation
Accept 'interpolating'. Do not accept 'extrapolation', which means estimating outside the range of the data.
Question 2
2 marks
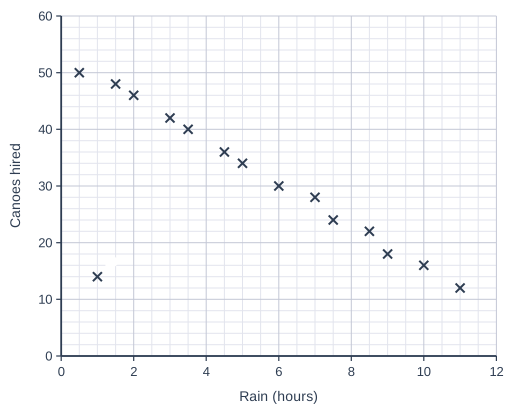
A canoe-hire centre recorded the number of hours of rain and the number of canoes it hired out on 15 days. The scatter graph shows the results.
On the day shown by point P, most of the centre's canoes were being repaired.
Should the owner leave out point P when she draws a line of best fit? Explain your answer.
Model answer
Yes. On that day few canoes were hired because most of them were being repaired, not because of the weather. So P does not fit the pattern of the other days. Including it would pull the line of best fit down on the left and make estimates for dry days too low.
Explanation
Leave an outlier out of a line of best fit when you know it was caused by something unusual, such as a mistake or a special event. The repairs explain why P is so low, so it tells you nothing about how rain affects canoe hire. Only leave out outliers when there is a good reason, not just because they look odd.
Mark scheme
1 mark
Yes (leave it out), with a relevant but incomplete reason, e.g. 'P is an outlier' or 'P does not fit the pattern'
'Yes' with no reason scores 0.
1 mark
Yes, with a complete reason: few canoes were hired that day because they were being repaired, not because of the rain, so P does not show the usual link between rain and canoe hire; including it would pull the line down at the dry end and make estimates worse
The complete reason must give the cause (the repairs: an unusual day, not the weather) or the effect on the line. A complete correct reason on its own scores both marks.
Question 3
3 marks
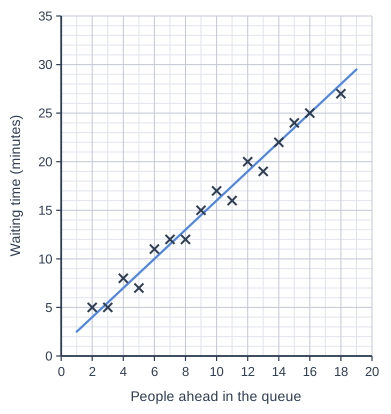
The scatter graph shows the number of people in the queue ahead of some customers at a café, and how long each customer then waited to be served. A line of best fit has been drawn.
Work out the gradient of the line of best fit. Explain what the gradient tells you about the waiting times.
Model answer
The line goes through (4, 7) and (16, 25). Gradient \(= \dfrac{25 - 7}{16 - 4} = \dfrac{18}{12} = 1.5\) For each extra person ahead in the queue, a customer waits about 1.5 minutes longer.
Explanation
Choose two points far apart where the line crosses grid lines exactly, then divide the change in waiting time by the change in the number of people. The gradient is a rate: minutes per person. So 1.5 means each person ahead adds about one and a half minutes, roughly the time it takes to serve one customer. A common mistake is to use two of the crosses instead of points on the line.
Mark scheme
1 mark
A correct method using two points on the line, e.g. \(\dfrac{25 - 7}{16 - 4}\) or \(\dfrac{18}{12}\); or the correct gradient 1.5 with no working
Any two points read from the line, e.g. (2, 4) and (18, 28); each reading within half a small square (0.5) of the line is fine.
1 mark
1.5
Accept \(\dfrac{3}{2}\). Follow through their own readings: accept any gradient in [1.4, 1.6] worked out correctly from two points read from the line. A correct gradient with no working scores the first two marks.
1 mark
Meaning in context: each extra person in the queue adds about 1.5 minutes to the waiting time (it takes about 1.5 minutes to serve each person)
Follow through their gradient. Must mention the extra time for each extra person. 'The line goes up 1.5 each time' with no context does not score this mark.
Question 4
4 marks
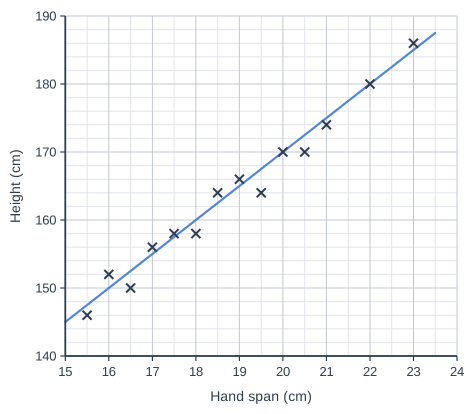
The scatter graph shows the hand spans and the heights of 14 pupils. A line of best fit has been drawn.
Find the equation of the line of best fit. Write it in the form \(y = mx + c\), where \(x\) is the hand span in cm and \(y\) is the height in cm.
Use your equation to estimate the height of a pupil whose hand span is 21.5 cm.
Model answer
The line goes through (16, 150) and (22, 180). Gradient \(m = \dfrac{180 - 150}{22 - 16} = \dfrac{30}{6} = 5\) \(150 = 5 \times 16 + c\), so \(c = 150 - 80 = 70\) \(y = 5x + 70\) When \(x = 21.5\): \(y = 5 \times 21.5 + 70 = 107.5 + 70 = 177.5\) Estimated height: 177.5 cm
Explanation
Find the gradient from two points far apart on the line. The axes do not start at 0, so you cannot read \(c\) from the graph: substitute a point on the line into \(y = 5x + c\) instead. The gradient means each extra centimetre of hand span goes with about 5 cm more height. A common mistake is to take \(c\) as the number where the line meets the left-hand side of the grid, which is not the \(y\)-axis here.
Mark scheme
1 mark
A correct method for the gradient using two points on the line, e.g. \(\dfrac{180 - 150}{22 - 16}\); or the correct answers \(y = 5x + 70\) and 177.5 cm with no working
Each reading within half a small square of the line (0.25 cm of hand span, 1 cm of height) is fine.
1 mark
\(m = 5\)
Follow through their own readings: accept any gradient in [4.6, 5.4] worked out correctly from two points read from the line.
1 mark
\(y = 5x + 70\)
Accept \(y = 70 + 5x\). Follow through their gradient, with \(c\) worked out from a point on the line, e.g. \(150 = 5 \times 16 + c\). The hand span axis starts at 15, so \(c\) cannot be read off the graph: do not accept \(c = 145\) (where the line meets the left edge of the grid, at a hand span of 15 cm) or \(c = 140\).
1 mark
177.5 (cm)
Follow through their equation. Also accept a value read from the graph in [176.5, 178.5]. A correct answer with no working scores full marks.
Ready to try the rest? Every answer you write is marked against the mark scheme, so you can see exactly where the marks are.
Ctrl + Enter to check
Study HelperHints first, answers after you try
Stuck on this one? Ask for a hint and I’ll point you in the right direction, without giving the answer away. Once you’ve checked your answer, I’ll show you how the marks are awarded.