Practise 21 questions on Distance-time and speed-time graphs for Year 9 Maths. Write your answer and get it marked in seconds against the mark scheme, point by point, with the Study Helper on hand if you get stuck.
21 questions
1–5 marks each
Instant marking
No sign-up needed
20 questions, marked as you go
Sample questions with model answers
Here are 4 of the questions in this topic, each with a model answer, an explanation of why it earns the marks and the mark scheme.
Question 1
1 mark
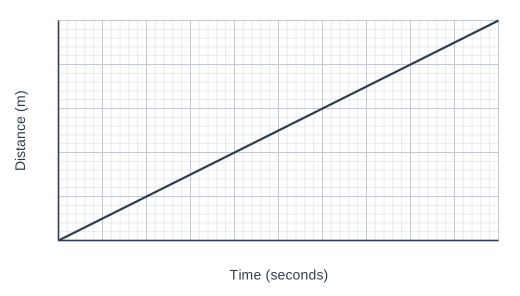
A toy car moves along a straight track at a constant speed.
The graph shows the distance the car has travelled.
Work out the speed of the car in metres per second.
Model answer
In 10 seconds the car travels 25 m. Speed \(= 25 \div 10 = 2.5\) m/s
Explanation
Speed is distance divided by time, which is the gradient of a distance-time graph. Choose a point on the line that is easy to read, such as 25 m at 10 seconds, and divide the distance by the time. A common mistake is to divide the time by the distance and get 0.4.
Mark scheme
1 mark
2.5 (m/s)
For example 25 m in 10 seconds, or 10 m in 4 seconds. Each reading is accepted within half a small square: a distance within 0.5 m (e.g. any value in [9.5, 10.5] at 4 seconds) and a time within 0.1 seconds (e.g. any value in [3.9, 4.1] at 10 m). A speed worked out correctly from their own readings within these ranges scores (follow through). Accept 2.5 or 2.5 m/s. Do not accept 0.4 (time divided by distance). A correct answer with no working scores full marks.
Question 2
2 marks
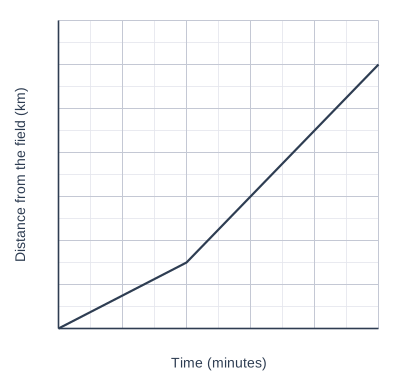
A hot-air balloon drifts away from the field where it took off. The wind gets stronger during the flight.
The graph shows the balloon's distance from the field.
Work out the speed of the balloon between 20 minutes and 50 minutes. Give your answer in metres per second.
Model answer
Between 20 and 50 minutes the balloon goes from 3 km to 12 km. That is 9 km in 30 minutes. 9 km = 9000 m and 30 minutes = 1800 seconds. \(9000 \div 1800 = 5\) The speed is 5 m/s.
Explanation
Read the distance and the time for that section only: 9 km in 30 minutes. For metres per second, change the distance into metres and the time into seconds, then divide. You could also find 18 km/h first and divide by 3.6. A common mistake is to stop at 18 km/h or 0.3 km per minute, which are the right speed in the wrong units.
Mark scheme
1 mark
9 km in 30 minutes used, e.g. 9000 m in 1800 seconds, or 300 m per minute, or 18 km/h; or the correct answer 5 m/s with no working
Reading both values from the graph (from 3 km to 12 km, from 20 to 50 minutes) and starting to change the units. The times, 20 and 50 minutes, are given in the question. Each distance is read within half a small square (0.5 km): any value in [2.5, 3.5] at 20 minutes and any value in [11.5, 12.5] at 50 minutes.
1 mark
5 (m/s)
Do not accept 18 (km/h, not changed into m/s), 0.3 (kilometres per minute), 300 (metres per minute) or 4 (12 km in 50 minutes, using the whole graph). Follow through: a speed in m/s worked out correctly from their own readings within the ranges in the first mark's comments scores this mark. A correct answer with no working scores full marks.
Question 3
3 marks
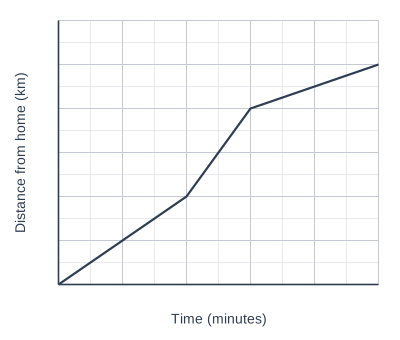
Mei cycles to her friend's house without stopping. Her route has a flat part, an uphill part and a downhill part, but not in that order. She is fastest going downhill and slowest going uphill.
The graph shows her distance from home.
Which part of the route does Mei cycle between 30 and 50 minutes? Work out her speed going downhill, in km/h.
Model answer
0 to 20 minutes: 4 km in 20 minutes = 12 km/h 20 to 30 minutes: 4 km in 10 minutes = 24 km/h 30 to 50 minutes: 2 km in 20 minutes = 6 km/h The slowest part, from 30 to 50 minutes, is uphill. The fastest part, from 20 to 30 minutes, is downhill: 24 km/h.
Explanation
The steepness of a distance-time graph shows the speed: the steeper the line, the faster Mei is going. The least steep section is the slowest, so it is the uphill part, and the steepest section is the downhill part. To find the downhill speed, scale 4 km in 10 minutes up to 60 minutes. A common mistake is to look for a section that looks like a hill: the graph shows distance, not height.
Mark scheme
1 mark
Uphill
Between 30 and 50 minutes the graph is least steep, so Mei is slowest (2 km in 20 minutes, 6 km/h). Accept 'the uphill part' with or without a reason. Each reading is accepted within half a small square: a time within 2.5 minutes (e.g. any value in [17.5, 22.5] for 20 minutes and [27.5, 32.5] for 30 minutes) and a distance within 0.5 km (e.g. any value in [3.5, 4.5] for 4 km and [7.5, 8.5] for 8 km).
1 mark
The steepest section, from 20 to 30 minutes, used: 4 km in 10 minutes, e.g. \(4 \times 6\) or 0.4 km per minute; or the correct answer 24 km/h with no working
Also award this mark for a correct method for the speed of another section they chose as downhill (12 km/h for 0 to 20 minutes). Readings within the ranges in the first mark's comments are accepted.
1 mark
24 (km/h)
Do not accept 12 (the flat part) or 6 (the uphill part). Follow through: a speed worked out correctly from their own readings of the steepest section, within the ranges in the first mark's comments, scores this mark. A correct answer with no working scores full marks.
Question 4
4 marks
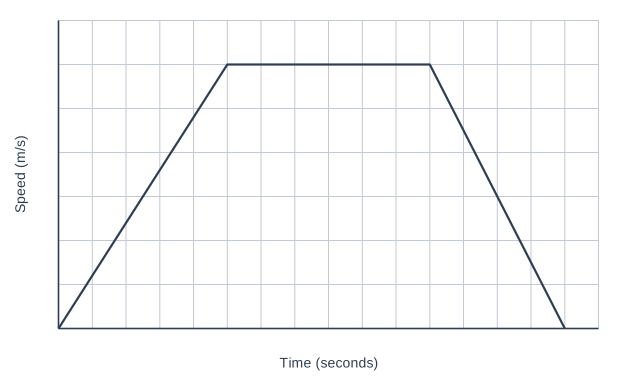
A tram travels between two stops. The graph shows its speed.
Jo says, "The tram travels more than half of the distance between the stops at a constant speed."
Work out how far apart the two stops are. Is Jo right? Show how you decide.
Model answer
Speeding up: \(\dfrac{1}{2} \times 25 \times 12 = 150\) m Constant speed: \(30 \times 12 = 360\) m Slowing down: \(\dfrac{1}{2} \times 20 \times 12 = 120\) m Distance between the stops \(= 150 + 360 + 120 = 630\) m Half of 630 m is 315 m, and 360 m is more than 315 m. Jo is right.
Explanation
The distance is the area under the speed-time graph. Split it into a triangle, a rectangle and another triangle, or use the area of a trapezium. The constant-speed part is the rectangle, 360 m, which is more than half of 630 m. A common mistake is to compare times instead of distances: the tram is at constant speed for less than half of the time, but it is moving fastest then, so it covers more than half of the distance.
Mark scheme
1 mark
One correct part of the area, e.g. \(\dfrac{1}{2} \times 25 \times 12 = 150\) or \(30 \times 12 = 360\) or \(\dfrac{1}{2} \times 20 \times 12 = 120\); or the correct answer 630 m with no working
The whole area as one trapezium, \(\dfrac{1}{2} \times (30 + 75) \times 12\), scores the first two marks. Each reading is accepted within half a grid square: the top speed any value in [11, 13] m/s, and the times 25, 55 and 75 seconds any values in [22.5, 27.5], [52.5, 57.5] and [72.5, 77.5]. Areas worked out correctly from their own readings within these ranges score (follow through).
1 mark
All three parts correct (150, 360 and 120), or \(\dfrac{1}{2} \times (30 + 75) \times 12\)
1 mark
630 (m)
Follow through: a total worked out correctly from their own readings within the ranges in the first mark's comments scores this mark. A correct distance of 630 m with no working scores the first three marks.
1 mark
Yes, Jo is right, with a correct comparison of distances: 360 m is more than half of 630 m (315 m), or 360 m is more than \(150 + 120 = 270\) m
Follow through their total and their constant-speed distance. A comparison of times scores 0 for this mark: the tram is at a constant speed for 30 of the 75 seconds, which is less than half the time, but the question is about distance. 'Yes' with no correct comparison scores 0 for this mark.
Ready to try the rest? Every answer you write is marked against the mark scheme, so you can see exactly where the marks are.
Ctrl + Enter to check
Study HelperHints first, answers after you try
Stuck on this one? Ask for a hint and I’ll point you in the right direction, without giving the answer away. Once you’ve checked your answer, I’ll show you how the marks are awarded.