Level:
Correct: 0
Incorrect: 0
Marks: 0/0
Practice
Course:
Topics:
Year 9 Maths Smart practice A mixed round aimed at your weak spots
Unit 1
Number: standard form, indices and accuracy
Unit 2
Percentages and money
Unit 3
Algebraic expressions and proof
Unit 4
Equations and inequalities
Unit 5
Graphs and sequences
Unit 6
Ratio, proportion and rates
Unit 7
Congruence, similarity and transformations
Unit 8
Pythagoras' theorem and trigonometry
Unit 9
3D shapes and measures
Unit 10
Probability
Unit 11
Statistics
Avg
score:
–
Topics
done:
0/46

Choosing and interpreting statistical diagrams

Practise 23 questions on Choosing and interpreting statistical diagrams for Year 9 Maths. Write your answer and get it marked in seconds against the mark scheme, point by point, with the Study Helper on hand if you get stuck.

  • 23 questions
  • 1–5 marks each
  • Instant marking
  • No sign-up needed
20 questions, marked as you go

Sample questions with model answers

Here are 4 of the questions in this topic, each with a model answer, an explanation of why it earns the marks and the mark scheme.

Question 1

1 mark

A pie chart shows how a charity spent its money last year.

The sector for running costs has an angle of \(54^\circ\).

What percentage of the money did the charity spend on running costs?

Model answer

\(\dfrac{54}{360} = 0.15\)
\(0.15 \times 100 = 15\)
15% of the money

Explanation

The whole pie chart is \(360^\circ\), which stands for all of the money. So the running costs are \(\dfrac{54}{360}\) of the money, which is 0.15, or 15%. A quick check: \(36^\circ\) is 10% of \(360^\circ\), and \(54^\circ\) is one and a half times \(36^\circ\). A common mistake is to think the angle is the percentage.

Mark scheme
  1. 1 mark

    15%

    From \(\dfrac{54}{360} \times 100\). Accept 15 without the % sign. Do not accept 54% (the angle) or 0.15 with no % sign. A correct answer with no working scores full marks.

Question 2

2 marks

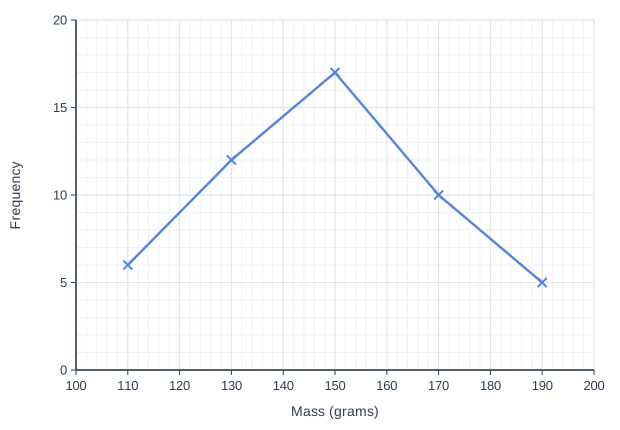
The frequency polygon shows the masses, \(m\) grams, of the potatoes in a sack. It was made from a grouped frequency table with the classes \(100 < m \le 120\), \(120 < m \le 140\), \(140 < m \le 160\), \(160 < m \le 180\) and \(180 < m \le 200\).

What fraction of the potatoes have a mass of more than 160 grams?

Line graph of frequency (y-axis, 0 to 20) against mass (grams) (x-axis, 100 to 200). The line joins the points (110, 6), (130, 12), (150, 17), (170, 10), (190, 5).

Model answer

Total: \(6 + 12 + 17 + 10 + 5 = 50\) potatoes
More than 160 g: the classes \(160 < m \le 180\) and \(180 < m \le 200\), so \(10 + 5 = 15\) potatoes
Fraction \(= \dfrac{15}{50} = \dfrac{3}{10}\)

Explanation

Each point on the polygon gives the frequency of one class, plotted at its midpoint. The potatoes over 160 g are in the last two classes, with midpoints 170 and 190. Add all five frequencies to get the total, 50. A common mistake is to include the class with midpoint 150, but those potatoes weigh 160 g or less.

Mark scheme
  1. 1 mark

    Total number of potatoes \(6 + 12 + 17 + 10 + 5 = 50\), or potatoes over 160 g \(10 + 5 = 15\); or the correct answer \(\dfrac{3}{10}\) with no working

    Each frequency is read to within half a small square (0.5), so the readings are the whole numbers 6, 12, 17, 10 and 5. Follow through from their readings.

  2. 1 mark

    \(\dfrac{15}{50}\) or \(\dfrac{3}{10}\)

    Accept any equivalent fraction, 0.3 or 30%. Do not accept \(\dfrac{5}{50}\) (the last class only) or \(\dfrac{32}{50}\) (including the class \(140 < m \le 160\)). A correct answer with no working scores full marks.

Question 3

3 marks

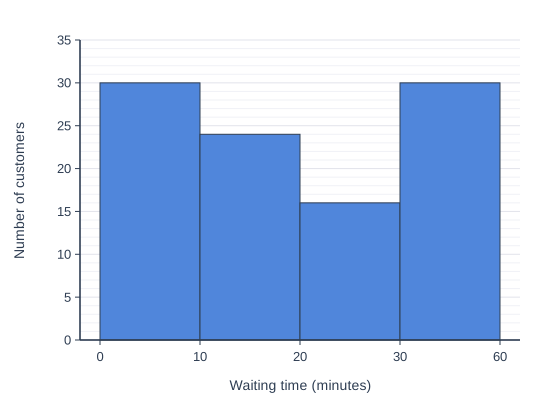
A food blogger made this bar chart of the times that 100 customers waited for a table at a restaurant.

She writes, "Look how many people wait a long time: the last bar is as tall as the first!"

Explain why the bar chart is misleading about the waiting times. Then describe one way to change the chart so that it is fair.

A bar chart with four touching bars of equal width. The horizontal axis is Waiting time (minutes), marked 0, 10, 20, 30 and 60 at equal distances apart, at the edges of the bars. The vertical axis is Number of customers, from 0 to 35, numbered every 5. The bars are: 0 to 10 minutes, 30 customers; 10 to 20 minutes, 24 customers; 20 to 30 minutes, 16 customers; 30 to 60 minutes, 30 customers.

Model answer

The horizontal axis goes 0, 10, 20, 30, 60, so the last class is 30 minutes wide: three times as wide as each of the other classes. But its bar is the same width as the others. Its 30 customers are spread over 30 minutes, which is only about 10 customers for each 10 minutes, so long waits look much more common than they are.
A fair chart: group the times in classes of equal width, such as 30 to 40, 40 to 50 and 50 to 60 minutes.

Explanation

When grouped data are shown with bars of the same width, the classes must be the same width too. A class that covers more values usually collects more data, so its bar looks too tall. Here about 10 customers waited in each 10-minute stretch from 30 to 60 minutes, far fewer than the 30 who waited 10 minutes or less. A common mistake is to say only that the numbers on the axis are not evenly spaced, without saying what this does to the picture.

Mark scheme
  1. 1 mark

    A relevant but incomplete reason, e.g. 'the last group is bigger than the others', 'the numbers along the bottom jump from 30 to 60', 'the groups are not the same size'

  2. 1 mark

    A complete correct reason: the last class (30 to 60 minutes) is 30 minutes wide, three times as wide as each of the others, but its bar is the same width as the others; its 30 customers are spread over 30 minutes, only about 10 for each 10 minutes, so long waits look more common than they are

    A complete correct reason on its own scores both of the first two marks. The reason must link the wider class to the bar looking too tall (or to long waits looking more common).

  3. 1 mark

    A fair change to the chart: group the times in classes of equal width (e.g. 30 to 40, 40 to 50 and 50 to 60 minutes) / make the last bar three times as wide and one third as tall, with the horizontal axis spaced to scale

    Do not accept 'make the last bar shorter' with no reason, 'start the vertical axis at 0' (it already does) or 'add a title'.

Question 4

4 marks

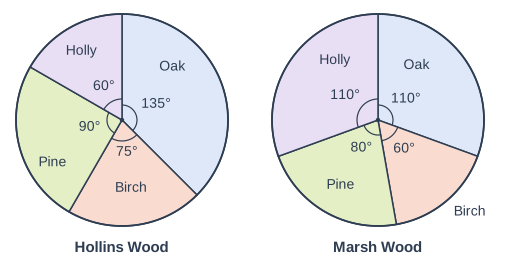
The pie charts in the diagram show the types of tree in two woods, Hollins Wood and Marsh Wood.

There are 480 trees in Hollins Wood. There are 160 pine trees in Marsh Wood.

Zoe says, "Hollins Wood has more birch trees than Marsh Wood, because its birch sector is bigger."

Is Zoe right? Show how you decide.

Two pie charts side by side, labelled "Hollins Wood" (left) and "Marsh Wood" (right). "Hollins Wood": A circle divided into sectors, drawn clockwise from the top (12 o'clock): Oak, 135° (printed); Birch, 75° (printed); Pine, 90° (printed); Holly, 60° (printed). Each printed angle is marked with a small arc at the centre. "Marsh Wood": A circle divided into sectors, drawn clockwise from the top (12 o'clock): Oak, 110° (printed); Birch, 60° (printed); Pine, 80° (printed); Holly, 110° (printed). Each printed angle is marked with a small arc at the centre.

Model answer

Hollins Wood: \(\dfrac{75}{360} \times 480 = 100\) birch trees.
Marsh Wood: the pine sector is \(80^\circ\) for 160 trees, so each degree stands for \(160 \div 80 = 2\) trees.
Birch: \(60 \times 2 = 120\) birch trees.
120 is more than 100, so Zoe is not right: Marsh Wood has more birch trees.

Explanation

A sector shows a fraction of its own wood, so a bigger sector does not mean more trees when the woods have different numbers of trees. Use the pine trees to find how many trees each degree stands for in Marsh Wood: 2 trees, so Marsh Wood has 720 trees. Its birch sector is a smaller fraction, \(\dfrac{60}{360} = \dfrac{1}{6}\), but of a much bigger wood. A common mistake is to use 480 trees for both woods.

Mark scheme
  1. 1 mark

    Hollins Wood birch: \(\dfrac{75}{360} \times 480 = 100\) trees

    Or \(480 \div 360 = \dfrac{4}{3}\) trees for each degree, then \(75 \times \dfrac{4}{3} = 100\).

  2. 1 mark

    Marsh Wood: \(160 \div 80 = 2\) trees for each degree (or the total, \(2 \times 360 = 720\) trees)

    From the pine sector: 160 trees for \(80^\circ\). Also accept \(\dfrac{60}{80} \times 160\) for this mark and the next.

  3. 1 mark

    Marsh Wood birch: \(60 \times 2 = 120\) trees

    Follow through from their trees per degree or total.

  4. 1 mark

    No, because Marsh Wood has 120 birch trees and Hollins Wood has only 100

    Follow through from their two numbers if both were found by a correct method. 'No' alone, or 'No' with a reason about the sizes of the sectors only, scores 0. Using 480 trees for Marsh Wood as well (giving 80 birch trees) scores at most the first mark.

Ready to try the rest? Every answer you write is marked against the mark scheme, so you can see exactly where the marks are.

Topic notes

Choosing and interpreting statistical diagrams

The big idea

Each kind of statistical diagram is good at showing one thing. Choosing the right one makes data easy to understand, and reading diagrams carefully stops you being misled.

Reminder from Years 7 and 8: a line graph shows change over time, and an axis that does not start at 0 makes small differences look big.

Choosing a diagram

You want to showA suitable diagramWhy
how one whole is shared outpie charteach sector is a fraction of the whole
counts for categories, or two groups side by sidebar chart or dual bar chartheights are easy to compare
totals split into partscomposite bar chartshows each total and its parts
grouped numerical datafrequency diagram or frequency polygonshows the shape of the data
a value recorded over timeline graphshows the trend
two values for each person or itemscatter graphshows any correlation

A pie chart only works when each person or item is in exactly one category.

Bar charts and pie charts

In a composite bar chart, the parts of each bar are stacked: the top of the bar is the total, and one part is the reading at its top minus the reading at its bottom.

A pie chart shows proportions, not numbers. To compare numbers in two pie charts, you need each chart's total.

Frequency polygons

A frequency polygon shows grouped data: each frequency is plotted above the midpoint of its class, and the points are joined with straight lines. Two polygons on the same axes are a good way to compare two distributions (the way each set of values is spread out).

Line graph of frequency (y-axis, 0 to 30) against mass (grams) (x-axis, 30 to 90). "Farm A" joins the points (40, 6), (50, 16), (60, 14), (70, 9), (80, 5). "Farm B" (dashed) joins the points (40, 0), (50, 8), (60, 26), (70, 16), (80, 0).
The masses of 50 eggs from each farm. The classes are 35 < m ≤ 45, 45 < m ≤ 55 and so on, so each point is at a class midpoint: 40 g, 50 g, 60 g, 70 g and 80 g.

Compare the masses of the eggs from the two farms.

Typical mass: Farm B's polygon peaks at 60 g, so its modal class is \(55 < m \le 65\). Farm A's peaks at 50 g, so its modal class is \(45 < m \le 55\). Farm B's eggs are generally heavier.

Spread: Farm B has no eggs in the first or last class, so all its eggs are between 45 g and 75 g, but Farm A's go from 35 g to 85 g. Farm B's masses are less spread out.

Time series

A time series is a line graph of data recorded at regular times. Look for the trend, the general direction over time, and any seasonal pattern: ups and downs that repeat at the same time each year. To see the trend, compare each value with the same season a year earlier.

Line graph of hot water bottles sold (y-axis, 0 to 4000) against quarter number (x-axis, 1 to 12). The line joins the points (1, 3600), (2, 1800), (3, 800), (4, 3000), (5, 3400), (6, 1600), (7, 700), (8, 2800), (9, 3200), (10, 1500), (11, 600), (12, 2600).
Hot water bottles sold by an online shop in each quarter (three months) of 2023, 2024 and 2025. Quarter 1 is January to March 2023, and quarter 12 is October to December 2025.

Describe the seasonal pattern, with a reason, and the trend in the shop's sales of hot water bottles.

Seasonal pattern: every year, the shop sells the most hot water bottles in January to March and the fewest in July to September, because people need them more in the cold months.

Trend: January to March went from 3,600 to 3,400 to 3,200, and every other quarter also fell each year. The trend is downwards: the shop sells fewer hot water bottles each year.

Misleading diagrams

A diagram is misleading when it gives the wrong idea about the data. Watch out for:

  • a vertical axis that does not start at 0;
  • graphs side by side with different scales;
  • a scale with uneven steps;
  • bars of different widths, or equal-width bars for classes of different widths;
  • a graph that shows only part of the data.

To fix a diagram, start at 0, use equal steps and the same scales, make the widths fair, and show all the data.

A campsite's website has a line graph of its monthly bookings from January to June 2025, rising from 40 to 800. It says, "June's bookings were 20 times January's!" In 2024, bookings rose from 50 in January to 950 in June. Why is the graph misleading, and how could it be fixed?

It is true that \(800 \div 40 = 20\), but camping is seasonal: bookings rise every year from winter to summer. In 2024 they rose \(950 \div 50 = 19\) times. Showing only January to June makes this seasonal rise look like growth.

Compare with the same months a year earlier: 40 against 50 in January, and 800 against 950 in June. Bookings are falling, not growing.

Fix: show at least two whole years, so each month can be compared with the same month the year before.

Remember

  • A frequency polygon plots each frequency at the midpoint of its class.
  • The trend is the general direction; a seasonal pattern repeats each year.
  • Compare two distributions with an average and the spread, in context.

Common mistakes

  • Reading the top part of a composite bar as if it started from 0.
  • Giving a midpoint, such as 60, instead of the modal class, \(55 < m \le 65\).
  • Describing the seasonal ups and downs when you are asked for the trend.
  • Saying a bigger sector means more people when two pie charts have different totals.

Top tip

Before you read any diagram, check the scale on each axis and the key: what does one small square stand for, and does the scale start at 0?

Study Helper Hints first, answers after you try

Stuck on this one? Ask for a hint and I’ll point you in the right direction, without giving the answer away. Once you’ve checked your answer, I’ll show you how the marks are awarded.