Level:
Correct: 0
Incorrect: 0
Marks: 0/0
Practice
Course:
Topics:
Year 9 Maths Smart practice A mixed round aimed at your weak spots
Unit 1
Number: standard form, indices and accuracy
Unit 2
Percentages and money
Unit 3
Algebraic expressions and proof
Unit 4
Equations and inequalities
Unit 5
Graphs and sequences
Unit 6
Ratio, proportion and rates
Unit 7
Congruence, similarity and transformations
Unit 8
Pythagoras' theorem and trigonometry
Unit 9
3D shapes and measures
Unit 10
Probability
Unit 11
Statistics
Avg
score:
–
Topics
done:
0/46

Estimating the mean from grouped data

Practise 27 questions on Estimating the mean from grouped data for Year 9 Maths. Write your answer and get it marked in seconds against the mark scheme, point by point, with the Study Helper on hand if you get stuck.

  • 27 questions
  • 1–5 marks each
  • Instant marking
  • No sign-up needed
20 questions, marked as you go

Sample questions with model answers

Here are 4 of the questions in this topic, each with a model answer, an explanation of why it earns the marks and the mark scheme.

Question 1

1 mark

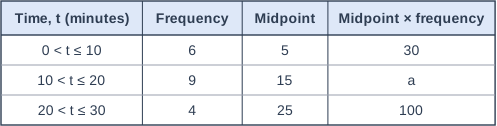
The table shows how long, \(t\) minutes, 19 people spent at a library one morning. It also shows the midpoint of each class.

Work out the value of \(a\).

Table with columns "Time, t (minutes)", "Frequency", "Midpoint", "Midpoint × frequency". Time, t (minutes): 0 < t ≤ 10; Frequency: 6; Midpoint: 5; Midpoint × frequency: 30 | Time, t (minutes): 10 < t ≤ 20; Frequency: 9; Midpoint: 15; Midpoint × frequency: a | Time, t (minutes): 20 < t ≤ 30; Frequency: 4; Midpoint: 25; Midpoint × frequency: 100.

Model answer

\(a\) = midpoint \(\times\) frequency
\(a = 15 \times 9 = 135\)

Explanation

Each number in the last column is the midpoint times the frequency, just like \(5 \times 6 = 30\) in the first row. It is an estimate of the total time spent by the people in that class: 9 people, each counted as 15 minutes. A common mistake is to use an end of the class, such as 10 or 20, instead of the midpoint.

Mark scheme
  1. 1 mark

    135

    Accept \(a = 135\). From \(15 \times 9\). Do not accept 90 (\(10 \times 9\), using the bottom of the class), 180 (\(20 \times 9\), using the top of the class) or 24 (\(15 + 9\)). A correct answer with no working scores full marks.

Question 2

2 marks

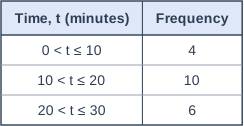
Some pupils at a games club timed how long, \(t\) minutes, they took to finish a jigsaw. The table shows the results.

Work out an estimate of the mean time.

Table with columns "Time, t (minutes)", "Frequency". Time, t (minutes): 0 < t ≤ 10; Frequency: 4 | Time, t (minutes): 10 < t ≤ 20; Frequency: 10 | Time, t (minutes): 20 < t ≤ 30; Frequency: 6.

Model answer

Midpoints: 5, 15, 25
\(5 \times 4 + 15 \times 10 + 25 \times 6 = 20 + 150 + 150 = 320\)
Total frequency \(= 4 + 10 + 6 = 20\)
Estimate of the mean \(= 320 \div 20 = 16\) minutes

Explanation

Count every pupil in a class as taking the midpoint time, so multiply each midpoint by its frequency and add: this estimates the total time. Then divide by the number of pupils, 20. A common mistake is to divide by 3, the number of rows in the table.

Mark scheme
  1. 1 mark

    Midpoints 5, 15 and 25 multiplied by the frequencies: \(5 \times 4 + 15 \times 10 + 25 \times 6\) or 320; or the correct answer 16 minutes with no working

  2. 1 mark

    16 (minutes)

    From \(320 \div 20\). Do not accept 106.7 (dividing by 3, the number of classes) or 21 (\(420 \div 20\), using the top of each class). A correct answer with no working scores full marks.

Question 3

3 marks

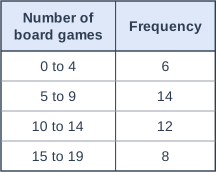
Bethan asked 40 pupils how many board games they have at home. The table shows the results.

Work out an estimate of the mean number of board games.

Table with columns "Number of board games", "Frequency". Number of board games: 0 to 4; Frequency: 6 | Number of board games: 5 to 9; Frequency: 14 | Number of board games: 10 to 14; Frequency: 12 | Number of board games: 15 to 19; Frequency: 8.

Model answer

Midpoints: \(\dfrac{0 + 4}{2} = 2\), then 7, 12 and 17
\(2 \times 6 + 7 \times 14 + 12 \times 12 + 17 \times 8 = 12 + 98 + 144 + 136 = 390\)
Estimate of the mean \(= 390 \div 40 = 9.75\) board games

Explanation

For whole-number classes such as 5 to 9, the midpoint is halfway between the smallest and largest values: \(\dfrac{5 + 9}{2} = 7\). An estimate of the mean does not have to be a whole number, even though each pupil has a whole number of board games. A common mistake is to use 7.5 as the midpoint of 5 to 9, as if the class went up to 10.

Mark scheme
  1. 1 mark

    Midpoints 2, 7, 12 and 17 (at least three correct); or the correct answer 9.75 with no working

  2. 1 mark

    \(2 \times 6 + 7 \times 14 + 12 \times 12 + 17 \times 8\) or 390, divided by 40

    Follow through their midpoints if each is inside its class: for example 2.5, 7.5, 12.5 and 17.5 give \(410 \div 40 = 10.25\), which scores this mark only.

  3. 1 mark

    9.75 (board games)

    Accept 9.75 rounded (e.g. 9.8 or 10) only if 9.75 is seen first. Do not accept 10.25 (from the midpoints 2.5, 7.5, 12.5 and 17.5). A correct answer with no working scores full marks.

Question 4

4 marks

You may use a calculator.

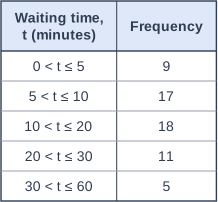
A theme park recorded how long, \(t\) minutes, 60 people queued for a ride. The table shows the results.

The park's target is a mean waiting time of less than 15 minutes.

Work out an estimate of the mean waiting time, correct to 1 decimal place. Use it to decide whether the park met its target.

Table with columns "Waiting time, t (minutes)", "Frequency". Waiting time, t (minutes): 0 < t ≤ 5; Frequency: 9 | Waiting time, t (minutes): 5 < t ≤ 10; Frequency: 17 | Waiting time, t (minutes): 10 < t ≤ 20; Frequency: 18 | Waiting time, t (minutes): 20 < t ≤ 30; Frequency: 11 | Waiting time, t (minutes): 30 < t ≤ 60; Frequency: 5.

Model answer

Midpoints: 2.5, 7.5, 15, 25, 45
\(2.5 \times 9 + 7.5 \times 17 + 15 \times 18 + 25 \times 11 + 45 \times 5\)
\(= 22.5 + 127.5 + 270 + 275 + 225 = 920\)
Estimate of the mean \(= 920 \div 60 = 15.333...\)
\(= 15.3\) minutes (1 d.p.)
15.3 is more than 15, so the park did not meet its target.

Explanation

The classes are different widths, so take care with the midpoints: the middle of \(10 < t \le 20\) is 15 and the middle of \(30 < t \le 60\) is 45. The estimate, 15.3 minutes, is just over the target, so it looks as if the target was not met. Because it is only an estimate and very close to 15, the park cannot be completely sure. A common mistake is to use 35 as the midpoint of the last class, which gives 14.5 and the wrong decision.

Mark scheme
  1. 1 mark

    Midpoints 2.5, 7.5, 15, 25 and 45 (at least four correct); or the correct answer 15.3 minutes, so the target was not met, with no working

  2. 1 mark

    \(2.5 \times 9 + 7.5 \times 17 + 15 \times 18 + 25 \times 11 + 45 \times 5\) or 920, divided by 60

    Follow through their midpoints if each is inside its class.

  3. 1 mark

    15.3 (minutes)

    Accept [15.25, 15.35] given to 1 decimal place, i.e. 15.3. The unrounded value 15.333... does not score this mark. Do not accept 14.5 (using 35 as the midpoint of \(30 < t \le 60\)) or 11.3 (treating every class as 5 minutes wide).

  4. 1 mark

    The target was not met, because 15.3 is more than 15

    Follow through their estimate, compared with 15. 'Not met' with no estimate scores 0. A comment that the estimate is only just above 15, so the real mean might be below it, is fine as long as the decision from the estimate is 'not met'. A correct answer with no working scores full marks.

Ready to try the rest? Every answer you write is marked against the mark scheme, so you can see exactly where the marks are.

Topic notes

Estimating the mean from grouped data

The big idea

A grouped frequency table shows how many values are in each class, but not the values themselves, so you cannot find the exact mean. You can estimate it by treating every value as if it were in the middle of its class.

Reminder from Year 8: the modal class is the class with the highest frequency, and running totals of the frequencies show which class contains the median.

Midpoints

The midpoint of a class is halfway between its two ends: add the ends and halve.

  • \(30 < t \le 60\) has midpoint \(\dfrac{30 + 60}{2} = 45\).
  • Classes can have different widths: \(2 < d \le 10\) has midpoint 6.
  • For counted data, such as 21 to 25 goals, use the smallest and largest values: the midpoint is 23.

Estimating the mean

  1. Multiply each midpoint, \(x\), by its frequency, \(f\). Each \(f \times x\) estimates the total of the values in that class.
  2. Add up the \(f \times x\) column to estimate the total of all the values.
  3. Divide by the total frequency (the number of values), not by the number of classes.

Grouped continuous data is often shown in a frequency diagram: a bar chart with touching bars.

The frequency diagram shows how long, \(t\) seconds, 25 members of a fitness class held a plank position. Find the modal class, the class that contains the median, and an estimate of the mean.

A frequency diagram of how long 25 members held a plank position. Time in seconds runs along the bottom from 0 to 120, marked every 30. Frequency runs up the side from 0 to 10. There are four touching bars of equal width: 0 to 30 seconds, frequency 2; 30 to 60 seconds, frequency 9; 60 to 90 seconds, frequency 6; 90 to 120 seconds, frequency 8.
The bars touch because time is continuous. The midpoint of each class is halfway along the bottom of its bar.

Read the frequencies from the bars: they add up to 25.

Time, \(t\) (seconds)\(f\)Midpoint, \(x\)\(f \times x\)Running total
\(0 < t \le 30\)215302
\(30 < t \le 60\)94540511
\(60 < t \le 90\)67545017
\(90 < t \le 120\)810584025
Total251725

Modal class: \(30 < t \le 60\), the tallest bar.

Median: the \(\dfrac{25 + 1}{2} = 13\)th time. The 12th to 17th times are in \(60 < t \le 90\), so this class contains the median.

Estimate of the mean: \(1725 \div 25 = 69\) seconds.

Why is it only an estimate?

The real times are not known: a time in the class \(30 < t \le 60\) could be 32 or 58 seconds, but it is counted as 45. Some times are above their midpoint and some below, so the estimate is usually close to the real mean, but not exact. Narrower classes usually give a better estimate.

Comparing two distributions

Compare an average and the spread, and say what each means in the context.

A hire company tested 30 Model A and 40 Model B electric scooters. Compare how far, \(d\) km, the two models went on one full charge.

Distance, \(d\) (km)MidpointModel AModel B
\(10 < d \le 20\)1506
\(20 < d \le 30\)25510
\(30 < d \le 40\)351511
\(40 < d \le 50\)45108
\(50 < d \le 60\)5505

Model A, with a calculator: key in \(25 \times 5 + 35 \times 15 + 45 \times 10\) to get 1100. Then \(1100 \div 30 = 36.666...\), which is 36.7 km to 1 decimal place.

Model B: \(15 \times 6 + 25 \times 10 + 35 \times 11 + 45 \times 8 + 55 \times 5 = 1360\), and \(1360 \div 40 = 34\) km.

Model A went further on average (36.7 km against 34 km), and its distances were less spread out: all were 20 to 50 km, but Model B's went from 20 km or less to over 50 km.

Stretch: a missing frequency

If you know the estimate of the mean, you can work backwards: write the totals using a letter and form an equation.

The coach finds that she missed out some members, who all held the plank for \(90 < t \le 120\) seconds. With them included, the estimate of the mean is 75 seconds. How many did she miss out?

Call the number missed out \(k\). Each one adds 105 (the class midpoint) to the \(f \times x\) total, and 1 to the total frequency.

\(\dfrac{1725 + 105k}{25 + k} = 75\)

Multiply both sides by \(25 + k\): \(1725 + 105k = 75(25 + k) = 1875 + 75k\)

So \(30k = 150\) and \(k = 5\).

Check: \((1725 + 525) \div 30 = 2250 \div 30 = 75\) seconds.

Remember

  • Estimate of the mean = total of \(f \times x\) \(\div\) total frequency.
  • It is only an estimate, because the exact values are not known.
  • Compare two groups with an average and the spread, in context.

Common mistakes

  • Dividing by the number of classes: \(1725 \div 4\) is over 431 seconds, longer than any of the times.
  • Using the tops (or bottoms) of the classes instead of the midpoints: the tops give 84 seconds for the plank, too big.
  • Taking 7.5 as the midpoint of 5 to 9 for counted data: it is \(\dfrac{5 + 9}{2} = 7\).
  • Giving the frequency, 9, instead of the modal class, \(30 < t \le 60\).

Top tip

Check that your estimate lies between the smallest and largest midpoints. If it does not, you have probably divided by the number of classes.

Study Helper Hints first, answers after you try

Stuck on this one? Ask for a hint and I’ll point you in the right direction, without giving the answer away. Once you’ve checked your answer, I’ll show you how the marks are awarded.