Level:
Correct: 0
Incorrect: 0
Marks: 0/0
Practice
Course:
Topics:
Year 9 Maths Smart practice A mixed round aimed at your weak spots
Unit 1
Number: standard form, indices and accuracy
Unit 2
Percentages and money
Unit 3
Algebraic expressions and proof
Unit 4
Equations and inequalities
Unit 5
Graphs and sequences
Unit 6
Ratio, proportion and rates
Unit 7
Congruence, similarity and transformations
Unit 8
Pythagoras' theorem and trigonometry
Unit 9
3D shapes and measures
Unit 10
Probability
Unit 11
Statistics
Avg
score:
–
Topics
done:
0/46

Cubic, reciprocal and exponential graphs

Practise 22 questions on Cubic, reciprocal and exponential graphs for Year 9 Maths. Write your answer and get it marked in seconds against the mark scheme, point by point, with the Study Helper on hand if you get stuck.

  • 22 questions
  • 1–5 marks each
  • Instant marking
  • No sign-up needed
20 questions, marked as you go

Sample questions with model answers

Here are 4 of the questions in this topic, each with a model answer, an explanation of why it earns the marks and the mark scheme.

Question 1

1 mark

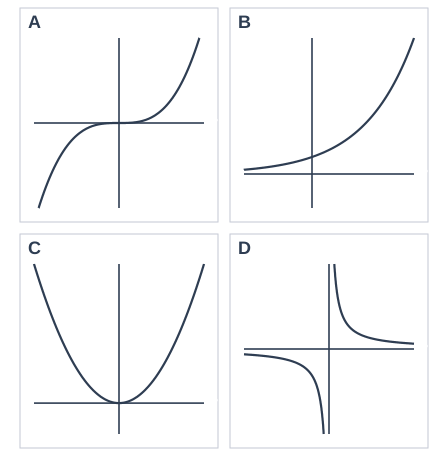
The diagram shows sketches of four graphs, A, B, C and D.

Which graph is \(y = 2^x\)? Write the letter.

Four sketch graphs, labelled A, B, C and D, each on a pair of axes that cross at O, with no scale marked. A: a curve that rises steeply from the bottom left, flattens out as it passes through O, then rises more and more steeply to the top right. B: a curve that is very close to the x-axis on the far left, stays above the x-axis, crosses the y-axis above O and rises more and more steeply to the right. C: a U-shaped curve whose lowest point is at O. D: a curve in two separate parts, one in the top right quarter and one in the bottom left quarter; each part gets closer and closer to both axes without touching them.

Model answer

B
The graph of \(y = 2^x\) stays above the \(x\)-axis, crosses the \(y\)-axis above O (at 1) and gets steeper and steeper to the right.

Explanation

An exponential graph such as \(y = 2^x\) is always above the \(x\)-axis, because \(2^x\) is never negative or zero. It crosses the \(y\)-axis at \((0, 1)\), since \(2^0 = 1\), and gets steeper and steeper. A common mistake is to choose the cubic, A, which also rises steeply, but it passes through O and goes below the \(x\)-axis on the left.

Mark scheme
  1. 1 mark

    B

    Accept 'B' or 'graph B'. Do not accept A (\(y = x^3\)), C (\(y = x^2\)) or D (\(y = \dfrac{1}{x}\)). More than one letter scores 0.

Question 2

2 marks

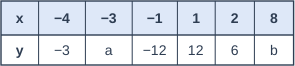
Here are some values of \(x\) and \(y\) for the graph of \(y = \dfrac{12}{x}\).

Work out the values of \(a\) and \(b\) in the table.

Table with columns "x", "−4", "−3", "−1", "1", "2", "8". x: y; −4: −3; −3: a; −1: −12; 1: 12; 2: 6; 8: b.

Model answer

\(a = 12 \div (-3) = -4\)
\(b = 12 \div 8 = 1.5\)

Explanation

For \(y = \dfrac{12}{x}\), divide 12 by each value of \(x\). A positive number divided by a negative number is negative, so \(a = -4\). The answer does not have to be a whole number: \(12 \div 8 = 1.5\). A common mistake is to multiply 12 by \(x\) instead of dividing.

Mark scheme
  1. 1 mark

    \(a = -4\); or the correct answers \(a = -4\) and \(b = 1.5\) with no working

    Do not accept 4 (sign wrong) or \(-36\) (from \(12 \times (-3)\)).

  2. 1 mark

    \(b = 1.5\)

    Accept \(\dfrac{3}{2}\) or \(1\dfrac{1}{2}\). Do not accept 96 (from \(12 \times 8\)) or 4 (from \(12 - 8\)). A correct answer with no working scores full marks.

Question 3

2 marks

Hana is looking at the graph of \(y = \dfrac{1}{x}\).

She says, "When \(x\) is positive, \(\dfrac{1}{x}\) is always smaller than \(x\)."

Is Hana right? Explain how you know.

Model answer

No. When \(x = 0.5\), \(\dfrac{1}{x} = 1 \div 0.5 = 2\), and 2 is bigger than 0.5.
Hana's rule only works when \(x\) is greater than 1. The graph of \(y = \dfrac{1}{x}\) meets the line \(y = x\) at \((1, 1)\), and between \(x = 0\) and \(x = 1\) it is above that line.

Explanation

One value of \(x\) that breaks a rule, called a counterexample, is enough to show the rule is wrong. Dividing 1 by a number between 0 and 1 gives an answer bigger than 1: for example, \(1 \div 0.25 = 4\). That is why the graph of \(y = \dfrac{1}{x}\) shoots up steeply close to the \(y\)-axis. A common mistake is to test only whole numbers such as 2, 5 and 10, which all fit Hana's rule.

Mark scheme
  1. 1 mark

    No, with a relevant but incomplete reason, e.g. 'it does not work for small numbers' or 'it does not work for numbers less than 1' with no example or explanation

    'No' on its own scores 0.

  2. 1 mark

    A complete correct reason, e.g. a value of \(x\) where it fails: when \(x = 0.5\), \(\dfrac{1}{x} = 2\), which is bigger than 0.5 / for any \(x\) between 0 and 1, \(\dfrac{1}{x}\) is more than 1, so it is bigger than \(x\) / when \(x = 1\), \(\dfrac{1}{x} = 1\), which is not smaller than \(x\)

    A complete correct reason on its own scores both marks. Testing only values of \(x\) greater than 1 (where Hana's rule works) and answering 'Yes' scores 0.

Question 4

4 marks

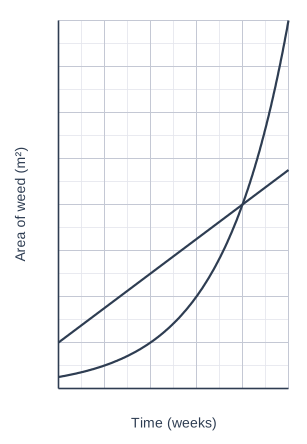
Weed is growing on two ponds, A and B. The graph shows the area of weed on each pond over 5 weeks. Curve A is for pond A and line B is for pond B.

The area of weed on pond A doubles every week. The area of weed on pond B grows by the same amount every week.

After how many weeks is the area of weed the same on both ponds?

After 2 weeks, which pond has more weed? How much more?

Both areas keep growing in the same way. Explain why, once the areas are the same, pond A will have more weed than pond B from then on.

A graph of Area of weed (m²) (vertical axis, 0 to 32, marked every 4) against Time (weeks) (horizontal axis, 0 to 5, marked every 1), on a grid with 2 small squares to each large square. Curve A is an exponential curve, increasing more and more steeply from left to right; its key points can be read from the grid. Line B is a straight line sloping upwards from left to right; its position can be read from the grid. Curve A and line B cross at one point, which can be read from the grid.

Model answer

The curve and the line cross at 4 weeks, so the areas are the same (16 m²) after 4 weeks.
After 2 weeks: pond A has 4 m² and pond B has 10 m².
Pond B has \(10 - 4 = 6\) m² more weed.
Pond A's weed doubles every week, so it grows by more each week: by 16 m² in week 5, then by 32 m², and so on. Pond B's weed grows by only 3 m² each week. So after week 4, pond A always has more weed.

Explanation

Where the two graphs cross, the areas are equal. To compare the ponds, read both graphs at the same time. Exponential growth starts slowly, but because the area keeps doubling, it soon overtakes growth that adds the same amount each week. A common mistake is to say pond A always has more weed, but for the first 4 weeks pond B has more.

Mark scheme
  1. 1 mark

    4 (weeks)

    The curve and the line cross at \((4, 16)\). Accept any value in [3.75, 4.25] (half a small square either side of 4). Accept 'week 4' or 'after 4 weeks'. A correct answer with no working scores this mark.

  2. 1 mark

    Both readings after 2 weeks: pond A 4 m² and pond B 10 m²; or the correct answer pond B by 6 m² with no working

    Accept each reading within 1 m² (half a small square): pond A any value in [3, 5] and pond B any value in [9, 11]. May be implied by a correct difference of 6 m² for pond B.

  3. 1 mark

    Pond B, by 6 m²

    Both needed. Follow through from the student's own readings if each is within 1 m² (half a small square) of the true value. Ignore a missing unit. Correct answers to the first two parts with no working score the first three marks; the last mark needs the explanation.

  4. 1 mark

    A correct explanation: the weed on pond A doubles every week, so it grows by more and more each week (by 16 m² in week 5, then 32 m², and so on), but the weed on pond B grows by only 3 m² each week / the exponential curve gets steeper and steeper, but the line rises by the same amount each week, so once the curve is above the line it stays above

    Do not accept 'A is above B on the graph' on its own: the question asks why this carries on after the graph ends.

Ready to try the rest? Every answer you write is marked against the mark scheme, so you can see exactly where the marks are.

Topic notes

Cubic, reciprocal and exponential graphs

The big idea

You already know straight lines and U-shaped quadratic graphs. Three more kinds of graph have shapes of their own: cubic graphs such as \(y = x^3\), reciprocal graphs such as \(y = \dfrac{1}{x}\), where you divide by \(x\), and exponential graphs such as \(y = 2^x\), where \(x\) is the power. If you know the shapes, you can match a graph to its equation.

Tables of values

\(x\)−2−10123
\(y = x^3\)−8−101827
\(y = \dfrac{6}{x}\)−3−6no value632
\(y = 2^x\)¼½1248
  • Cubing a number means multiplying it by itself three times: \(3^3 = 3 \times 3 \times 3 = 27\). A negative number cubed stays negative: \((-2)^3 = -8\).
  • For \(y = \dfrac{6}{x}\), divide 6 by \(x\). There is no value when \(x = 0\), because you cannot divide by 0.
  • For \(y = 2^x\), a negative power means "one over": \(2^{-1} = \dfrac{1}{2}\) and \(2^{-2} = \dfrac{1}{4}\). Every value is positive.

Work out \(y = 2 - x^3\) for each whole number \(x\) from \(-2\) to 2. Describe the shape of its graph.

\(x = -2\): \(y = 2 - (-8) = 10\)

\(x = -1\): \(y = 2 - (-1) = 3\)

\(x = 0\), 1 and 2: \(y = 2\), \(2 - 1 = 1\) and \(2 - 8 = -6\)

The values fall as \(x\) goes up. The graph is the S shape of \(y = x^3\) turned upside down and moved up 2, so it crosses the \(y\)-axis at \((0, 2)\).

Recognising the shapes

TypeExampleShape of the graph
Linear\({y = 2x + 1}\)a straight line
Quadratic\(y = x^2\)a U shape (∩ if the \(x^2\) term is negative)
Cubic\(y = x^3\)an S shape that flattens out at the origin but keeps rising
Reciprocal\(y = \dfrac{1}{x}\)two separate parts that get closer and closer to both axes but never touch them
Exponential\(y = 2^x\)crosses the \(y\)-axis at 1, never goes below the \(x\)-axis and gets steeper and steeper
A coordinate grid with x from −3 to 3 and y from −6 to 8; the x-axis is marked every 0.5 and the y-axis every 1, and the axes cross at the origin O. The curve labelled "y = x³" is an S-shaped cubic curve, rising from bottom left to top right: it crosses the x-axis at (0, 0). The curve labelled "y = 2/x" is a reciprocal-type curve in 2 separate branches: it has a vertical asymptote at x = 0, where the curve breaks into separate branches; it gets closer and closer to the line y = 0 (the x-axis) at both ends without reaching it. The curve labelled "y = 2^x" is an exponential curve, increasing more and more steeply from left to right: it crosses the y-axis at (0, 1); it gets closer and closer to the line y = 0 (the x-axis) as x goes further left without reaching it. The curve labelled "y = x³" and the curve labelled "y = 2/x" cross at about (−1.2, −1.7) and about (1.2, 1.7). The curve labelled "y = x³" and the curve labelled "y = 2^x" cross at about (1.4, 2.6). The curve labelled "y = 2/x" and the curve labelled "y = 2^x" cross at (1, 2).
The three new shapes. The cubic y = x³ passes through O. The reciprocal graph y = 2/x is in two parts and never touches the axes. The exponential graph y = 2ˣ crosses the y-axis at (0, 1) and stays above the x-axis.

To match values to an equation, test easy values such as \(x = 0\), and see how \(y\) changes each time \(x\) goes up by 1. The same amount added each time gives a straight line. The same number multiplied each time gives an exponential graph.

Each list of points lies on one of the graphs \(y = x^3 - 1\), \(y = \dfrac{3}{x}\) and \(y = 3^x\). Which is which?

  • A: \((-3, -1)\), \((1, 3)\), \((3, 1)\)
  • B: \((0, 1)\), \((1, 3)\), \((2, 9)\)
  • C: \((-1, -2)\), \((0, -1)\), \((2, 7)\)

Try \(x = 0\): \(y = 3^x\) gives 1 and \(y = x^3 - 1\) gives \(-1\), so B is \(y = 3^x\) and C is \(y = x^3 - 1\).

Check B: \(3^1 = 3\) and \(3^2 = 9\), so \(y\) is multiplied by 3 each time ✓

Check C: \((-1)^3 - 1 = -2\) and \(2^3 - 1 = 7\) ✓

That leaves A as \(y = \dfrac{3}{x}\): \(3 \div (-3) = -1\), \(3 \div 1 = 3\) and \(3 \div 3 = 1\) ✓. One point is not always enough: \((1, 3)\) is on both A and B.

Exponential growth and decay

In exponential growth, a quantity is multiplied by the same number in each equal step of time, like bacteria that double every hour, so the graph gets steeper and steeper. In exponential decay, it is multiplied by a number less than 1 each time, for example halved. The graph falls quickly at first, then more and more slowly, getting closer and closer to 0 without reaching it. The graph of \(y = \left(\dfrac{1}{2}\right)^x\), the mirror image of \(y = 2^x\) in the \(y\)-axis, has this shape. A cooling hot drink follows the same shape, but levels off at room temperature, not 0.

A graph of the amount of medicine in the blood in mg, from 0 to 100, against time in hours, from 0 to 20. Each small square is 0.5 hours across and 2.5 mg up. The curve starts at 100 mg at 0 hours. It falls steeply at first, then more and more slowly, and is still above 0 mg at 20 hours.
The amount of a medicine in a patient's blood after a 100 mg dose. Each small square is 0.5 hours across and 2.5 mg up.

Use the graph of the medicine. How long does the amount take to halve? Estimate the amount after 3 hours, and the time when it has fallen to 30 mg.

The amount falls from 100 mg to 50 mg in 5 hours, then from 50 mg to 25 mg in the next 5 hours. It halves every 5 hours.

Go up from 3 hours to the curve, then across: about 66 mg.

Go across from 30 mg to the curve, then down: about 8.7 hours.

Common mistakes

  • Making a negative cube positive: \((-2)^3 = -8\), not 8.
  • Multiplying by 3 instead of cubing: \(4^3 = 64\), not 12.
  • Thinking a negative power gives a negative answer: \(2^{-1} = \dfrac{1}{2}\), not \(-2\).
  • Multiplying instead of dividing: for \(y = \dfrac{6}{x}\), when \(x = 2\), \(y = 3\), not 12.
  • Mixing up \(y = x^3\) and \(y = 2^x\). Both rise steeply, but only the cubic passes through O and goes below the \(x\)-axis.

Top tip

To match a graph to its equation, try \(x = 0\) first. \(y = x^3\) gives 0, \(y = 2^x\) gives 1, and \(y = \dfrac{1}{x}\) gives no value at all.

Study Helper Hints first, answers after you try

Stuck on this one? Ask for a hint and I’ll point you in the right direction, without giving the answer away. Once you’ve checked your answer, I’ll show you how the marks are awarded.