
Level:
Correct: 0
Incorrect: 0
Marks: 0/0
Exam Practice
Course:
Topics:
Edexcel GCSE Geography B (Paper 2) Smart practice A mixed round aimed at your weak spots
Unit 4
Topic 4: The UK's evolving physical landscape
Unit 5
Topic 5: The UK's evolving human landscape
Unit 6
Topic 6: Geographical investigations
Avg
score:
–
Topics
done:
0/28

Urban fieldwork: enquiry questions and methods

Practise 26 exam-style questions on Urban fieldwork: enquiry questions and methods for Edexcel GCSE Geography B (Paper 2). Write your answer as you would in the exam and get it marked in seconds against the mark scheme, point by point, with the Study Helper on hand if you get stuck.

  • 26 questions
  • 1–8 marks each
  • Instant marking
  • No sign-up needed
20 questions, marked as you go

Sample questions with model answers

Here are 4 of the questions in this topic, each with a model answer, an explanation of why it earns the marks and the mark scheme an examiner would use.

Question 1

1 mark

A student wants to collect qualitative data on how residents feel about living in their area.

Identify which one of the following questions would collect qualitative data.

Choose your answer.

  • A How many years have you lived in this area?
  • B On a scale of 1 to 10, how safe do you feel in this area?
  • C How many times a week do you use the local park?
  • D What do you like most about living in this area, and why?

Model answer

D

Explanation

An open question such as D lets residents answer in their own words, giving descriptions and reasons, which are qualitative data. Option B is a common trap: it asks about a feeling, but the answer is a number on a rating scale, so the data are quantitative.

Mark scheme
  1. 1 mark

    D (What do you like most about living in this area, and why?)

    Accept the letter or the option written out; do not credit more than one answer. A is incorrect: the answer is a number of years, so it is quantitative data. B is incorrect: a rating on a scale of 1 to 10 records a feeling as a number, so it gives quantitative data. C is incorrect: the number of visits a week is a count, so it is quantitative data.
Question 2

2 marks

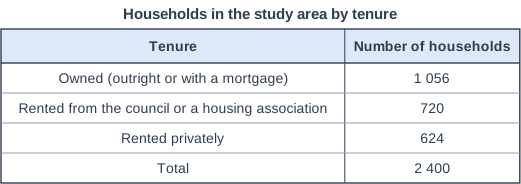
A group of students planned a questionnaire about quality of life in one area of a town. Figure 1 shows census data on the tenure of the households in the area: whether each household owns or rents its home (data written for this course).

The students decided to collect 50 questionnaires, each from a different household. They used stratified sampling so that each tenure group was represented in proportion to its share of the households.

Calculate the number of questionnaires the students should collect from households that rent privately. Show your working.

Households in the study area by tenure. Table with columns "Tenure", "Number of households". Tenure: Owned (outright or with a mortgage); Number of households: 1 056 | Tenure: Rented from the council or a housing association; Number of households: 720 | Tenure: Rented privately; Number of households: 624 | Tenure: Total; Number of households: 2 400.

Model answer

624 ÷ 2 400 = 0.26
0.26 × 50 = 13
The students should collect 13 questionnaires from households that rent privately.

Explanation

Stratified sampling shares the sample in proportion to the size of each group: privately renting households are 624 of the 2 400 households (26%), so they should make up 26% of the 50 questionnaires, which is 13. A common error is to share the questionnaires equally between the three tenure groups.

Mark scheme
  1. 1 mark

    Method: 624 ÷ 2 400 × 50 (or 624 ÷ 2 400 = 0.26 or 26%, then multiplied by 50)

    Correct answer: 13 questionnaires. Correct answer with no working scores full marks (2). Accept any correct method, e.g. 2 400 ÷ 50 = 48 households for each questionnaire, then 624 ÷ 48 = 13. Award 1 mark for correct working with a wrong answer. Do not accept 16.7 or 17 (the 50 questionnaires shared equally between the three groups) or 26 (the percentage, not the number of questionnaires).

  2. 1 mark

    Answer: 13

    Accept 13, 13 questionnaires or 13 households. Units are not required.

Question 3

4 marks

A group of students wants to find out whether the regeneration of Kingsmead, an area of an imaginary town, has improved residents' quality of life. As well as collecting data in Kingsmead, they plan to collect the same data in Ashgrove, a nearby area with similar housing that has not been regenerated.

Explain two reasons why the students should also collect data in Ashgrove.

Model answer

First, Ashgrove acts as a comparison (control) area. Some changes affect the whole town at once, such as more jobs or a new bus route. If quality of life turns out to be much better in Kingsmead than in Ashgrove, the difference is more likely to have been caused by the regeneration than by changes that affected the whole town.

Second, data from Ashgrove show whether the regeneration has affected people living nearby. Problems such as crime or parking may have been pushed into neighbouring streets, or rents may have risen, so collecting data in Ashgrove shows whether the regeneration has improved quality of life overall or simply moved problems elsewhere.

Explanation

Each reason needs a purpose for the comparison area (1) and an explanation of how it helps the students judge the effect of the regeneration (1). A similar area that has not changed works like a control in an experiment; simply saying 'to compare the areas' does not explain why the comparison matters.

Mark scheme
  1. 1 mark

    Identifies a first reason, e.g. Ashgrove is a comparison (control) area that separates the effect of regeneration from changes across the whole town / it shows what Kingsmead was probably like before regeneration (a baseline) / it shows whether the regeneration has affected nearby areas

    Examples: Ashgrove acts as a comparison (control) area (1): changes that affect the whole town, such as new jobs or a better bus service, affect both areas, so a difference between Kingsmead and Ashgrove is more likely to have been caused by the regeneration (1). There may be no data from Kingsmead before it was regenerated (1), so a similar area that has not changed shows what Kingsmead was probably like before, giving a baseline against which to measure the improvement (1). Collecting data in Ashgrove shows whether the regeneration has affected people living nearby (1), for example by pushing problems such as crime or parking into neighbouring streets, or by raising rents (1). Do not credit reasons about convenience alone (e.g. 'Ashgrove is close by'). Accept any other appropriate response.

  2. 1 mark

    Develops the first reason (how it helps the students judge the effect of the regeneration)

    A bare statement such as 'so the two areas can be compared', with no explanation of why the comparison helps, does not earn this mark.

  3. 1 mark

    Identifies a second, different reason

    The two reasons must be different, e.g. a comparison area that separates the effect of regeneration from town-wide change, and a check on whether problems have moved into nearby areas.

  4. 1 mark

    Develops the second reason

    Allow any other appropriate development.

Question 4

4 marks

Explain one advantage and one disadvantage of using census data to investigate how quality of life varies within an urban area.

Model answer

An advantage is that census data are published for small areas such as LSOAs, which each contain about 1,000-3,000 people. This means students can compare neighbourhoods within a town, for example the percentage of households with no car or in bad health, and choose contrasting areas for their fieldwork.

A disadvantage is that the census is held only every 10 years, and the most recent one in England and Wales was in 2021. An area that has been regenerated since then could now be very different, so the census may give a misleading picture of quality of life there today.

Explanation

Each half of the answer needs a clear point (1) and an explanation of why it matters for investigating quality of life (1). The best answers link the advantage or disadvantage to fieldwork, for example using census data to choose sites, or needing primary data on residents' views because the census does not record them.

Mark scheme
  1. 1 mark

    Identifies an advantage, e.g. the census covers (almost) every household / data are available for small areas such as LSOAs / it is free and easy to access online / it includes many indicators of quality of life

    Examples (advantage): The census asks every household the same questions (1), so data for different parts of a town can be compared fairly (1). Census data are published for small areas such as LSOAs (1), so students can see differences between neighbourhoods and choose contrasting fieldwork sites (1). The data are free to download from the ONS (1), which saves time compared with collecting the same information by questionnaire (1). It includes indicators such as car ownership, overcrowding and health (1), which together give a picture of deprivation in each area (1). Accept any other appropriate response.

  2. 1 mark

    Develops the advantage

    The development should explain why the advantage helps an investigation of quality of life.

  3. 1 mark

    Identifies a disadvantage, e.g. it is taken only every 10 years so may be out of date / it records facts, not people's views / area averages hide differences between streets / indicators only indirectly show quality of life

    Examples (disadvantage): The census is held only every 10 years; the most recent in England and Wales was in 2021 (1), so an area regenerated since then may look more deprived than it now is (1). It records facts such as car ownership and health but not people's views (1), so it cannot show how residents feel about their quality of life and must be combined with questionnaires or interviews (1). Data for an LSOA are an average for about 1,000-3,000 people (1), so a street with very different conditions may be hidden (1). The two points must be a genuine advantage and a genuine disadvantage, not the same idea reversed.

  4. 1 mark

    Develops the disadvantage

    Allow any other appropriate development.

Ready to try the rest? Every answer you write is marked against the mark scheme, so you can see exactly where the marks are.

Study Helper Hints first, answers after you try

Stuck on this one? Ask for a hint and I’ll point you in the right direction, without giving the answer away. Once you’ve checked your answer, I’ll show you how the marks are awarded.