Practise 25 exam-style questions on Human activity and change on a named coastline for Edexcel GCSE Geography B (Paper 2). Write your answer as you would in the exam and get it marked in seconds against the mark scheme, point by point, with the Study Helper on hand if you get stuck.
25 questions
1–8 marks each
Instant marking
No sign-up needed
20 questions, marked as you go
Sample questions with model answers
Here are 4 of the questions in this topic, each with a model answer, an explanation of why it earns the marks and the mark scheme an examiner would use.
Question 1
1 mark
State one human activity, other than coastal management, that can increase the rate of erosion on a coastline.
Model answer
Dredging sand and gravel from the seabed close to the coast.
Explanation
Many human activities other than defences change coastal processes: dredging removes sediment that would have built up beaches, and drains or buildings on cliff tops make cliffs wetter and heavier. One clear activity is enough for the mark. Naming a type of coastal defence does not score, because the question excludes coastal management.
Mark scheme
1 mark
Any one valid activity, e.g. dredging sand or gravel from the seabed / removing sand or shingle from beaches / building on cliff tops (adding weight or drainage water) / farming close to the cliff edge (field drains, ploughing to the edge) / trampling or removing vegetation on sand dunes / building a port or harbour wall that interrupts longshore drift / reclaiming salt marsh
Allow any other appropriate response. The activity must plausibly speed up erosion. Do not credit coastal management methods (sea walls, groynes, rock armour, beach replenishment), as the question excludes them. Do not credit vague answers such as 'pollution', 'tourism' or 'people' unless a way of increasing erosion is given (e.g. 'tourists trampling dunes' is creditworthy). Do not credit 'climate change' on its own.
Question 2
2 marks
Explain one way in which farming on land at the top of a cliff can increase the rate of cliff retreat.
Model answer
Field drains carry water from the fields and empty it onto the cliff face. This saturates the clay, making it heavier and weaker, so the cliff slumps more often.
Explanation
The first mark is for a farming activity that affects the cliff and the second for explaining how it speeds up retreat, usually through saturation and mass movement. Cliff retreat is not only caused by waves: processes on the cliff top matter too. Answers about water pollution do not answer the question.
Mark scheme
1 mark
Identifies a valid way, e.g. field drains empty water onto or into the cliff / ploughing right up to the cliff edge removes vegetation / removing hedgerows increases surface run-off / heavy machinery near the edge
Examples: Field drains empty water onto the cliff face (1) which saturates the clay so it becomes heavier and slumps more easily (1). Fields are ploughed to the cliff edge (1) so there are no roots to bind the soil, and rain washes it over the edge (1). Hedgerows are removed (1) so more rainwater runs off over the cliff top, cutting gullies (1). Heavy machinery works close to the edge (1) adding weight and vibration that can trigger collapse (1). Allow any other appropriate response.
1 mark
Develops the way, e.g. explains how this makes mass movement or erosion of the cliff more likely
The development must link the farming activity to cliff retreat (e.g. saturation, slumping, loss of binding roots, run-off). Do not credit 'farming pollutes the sea' or 'fertilisers run off' unless linked to cliff retreat.
Question 3
2 marks
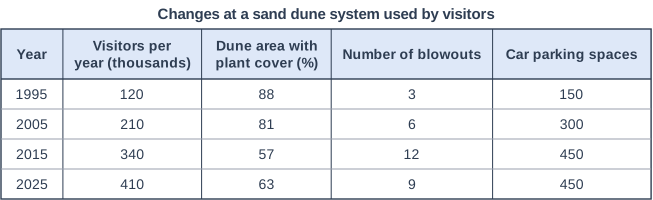
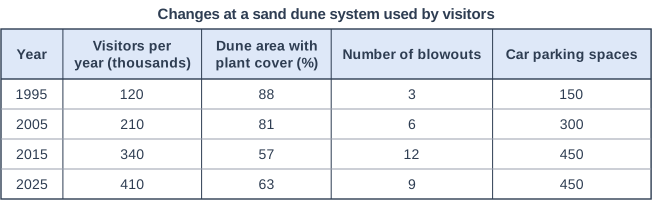
Figure 1 shows changes at a sand dune system that is popular with visitors. The data were written for this course. In 2016 fencing and boardwalks were built and marram grass was planted.
Suggest one reason why the dune area with plant cover increased between 2015 and 2025, even though the number of visitors increased.
Model answer
The fencing and boardwalks built in 2016 kept visitors on fixed paths and off the fragile dunes. With less trampling, the marram grass could regrow and bind the sand, so plant cover rose from 57% to 63%.
Explanation
The question gives a clue: management began in 2016. One mark is for a reason (fencing, boardwalks or planting) and one for explaining how it let vegetation recover. Saying that visitors fell contradicts the data.
Mark scheme
1 mark
Suggests a valid reason, e.g. fencing and boardwalks kept visitors off the fragile dunes / marram grass was planted / the number of car parking spaces did not increase after 2015
Examples: Boardwalks kept visitors to fixed routes (1) so there was less trampling and the vegetation could regrow (1). Marram grass was planted (1) and its roots bind the sand and it grows up through new sand, so blowouts were stabilised (1). Car parking stayed at 450 spaces (1) so visitor pressure did not spread to new parts of the dunes (1). Allow any other appropriate response.
1 mark
Develops the reason, e.g. explains how it allowed plants to recover or stabilised the sand
The development must explain why plant cover increased. Do not credit 'there were fewer visitors' - Figure 1 shows visitor numbers rose from 340 000 to 410 000.
Question 4
4 marks
Figure 1 shows changes at a sand dune system that is popular with visitors. The data were written for this course. In 2016 fencing and boardwalks were built and marram grass was planted.
Using Figure 1, explain two ways in which the increase in visitors may have changed this sand dune system.
Model answer
1. Visitors walking over the dunes trample the marram grass. Between 1995 and 2015 the area with plant cover fell from 88% to 57%, and without roots to bind it the bare sand is easily moved by the wind. 2. Once the sand is bare, wind scours hollows called blowouts. The number of blowouts rose from 3 to 12 between 1995 and 2015, breaking up the dune ridges and blowing sand further inland.
Explanation
Each way needs a change linked to visitors (1) and an explanation of how it alters the dunes (1), and the stem asks you to use Figure 1, so quote data such as the fall in plant cover or the rise in blowouts. Without any evidence from the figure the maximum is 3. The changes after 2016 were caused by management, not by visitors.
Mark scheme
1 mark
Identifies a first way, using evidence from Figure 1, e.g. trampling has destroyed vegetation (plant cover fell from 88% to 57% between 1995 and 2015) / more blowouts have formed (from 3 to 12 by 2015) / car parks have been built on the dunes (spaces rose from 150 to 450)
Max 3 if no evidence from Figure 1 is used. Award 1 mark for each way and 1 further mark for its development, up to 2 marks for each way; evidence from Figure 1 can be part of either mark. Examples: Visitors trample the marram grass, and plant cover fell from 88% to 57% (1) so the roots no longer bind the sand and it is easily moved by the wind (1). Wind erodes the bare sand into hollows, and blowouts increased from 3 to 12 (1) so the dune ridges are broken up and sand is blown inland (1). Parking grew from 150 to 450 spaces (1) so part of the dunes has been flattened and covered by car parks, a direct loss of dune landscape (1). Allow any other appropriate response.
1 mark
Develops the first way
The development must explain how the dune system changes (loss of binding roots, wind erosion, blowouts, loss of dune area).
1 mark
Identifies a second, different way, using evidence from Figure 1
The two ways must be different. Loss of vegetation and the formation of blowouts can be two ways if each is developed separately, but do not credit the same chain twice.
1 mark
Develops the second way
Do not credit explanations of the 2016 management (that is not an effect of the increase in visitors).
Ready to try the rest? Every answer you write is marked against the mark scheme, so you can see exactly where the marks are.
Ctrl + Enter to check
Study HelperHints first, answers after you try
Stuck on this one? Ask for a hint and I’ll point you in the right direction, without giving the answer away. Once you’ve checked your answer, I’ll show you how the marks are awarded.