Practise 26 exam-style questions on Human activity and flooding on a named river for Edexcel GCSE Geography B (Paper 2). Write your answer as you would in the exam and get it marked in seconds against the mark scheme, point by point, with the Study Helper on hand if you get stuck.
26 questions
1–8 marks each
Instant marking
No sign-up needed
20 questions, marked as you go
Sample questions with model answers
Here are 4 of the questions in this topic, each with a model answer, an explanation of why it earns the marks and the mark scheme an examiner would use.
Question 1
1 mark
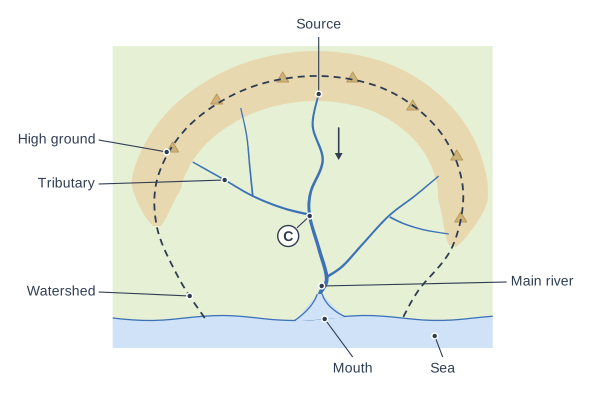
Study Figure 1, which shows a drainage basin. A town has grown up at the place labelled C.
State one reason why a town at C is likely to be at high risk of flooding.
Model answer
C is where the tributary joins the main river, so the discharge of both rivers combines there and the channel has to carry floodwater from both.
Explanation
C marks a confluence: the flow from two rivers adds together, and if both peak at the same time the combined discharge can exceed the channel's capacity. Towns at confluences, such as Carlisle and Cockermouth, have flooded many times for this reason.
Mark scheme
1 mark
C is a confluence, so the water (discharge) of the main river and the tributary combines there / floodwater from two rivers arrives at the same place / the flood peaks of the two rivers may arrive at the same time
Accept that one river can back up (be held back) by high water in the other. Accept that confluences are often on low, flat flood plain land. Do not credit 'there is more water' without reference to both rivers or the confluence. Do not credit 'it is near the sea' (C is halfway down the basin).
Question 2
2 marks
Explain one way in which deforestation can affect the lag time of a river.
Model answer
When trees are removed, less rain is intercepted by leaves and branches. More rain reaches the ground at once and runs off over the surface into the river, so the lag time becomes shorter.
Explanation
The first mark is for a process that trees provide (interception, transpiration, infiltration), the second for linking its loss to a shorter lag time. Stating only that lag time falls does not explain why.
Mark scheme
1 mark
Identifies a valid way, e.g. fewer trees means less interception of rain / less transpiration / tree roots no longer help water infiltrate
Examples: With fewer trees less rain is intercepted by leaves and branches (1) so more rain reaches the ground at once and runs off quickly, shortening the lag time (1). Without roots to open up the soil, infiltration is slower (1) so more water flows over the surface and the river peaks sooner (1). Bare soil is compacted by heavy rain (1) so runoff increases and lag time shortens (1). Accept any other appropriate response.
1 mark
Develops the way, e.g. so more water reaches the river quickly as surface runoff and the lag time is shorter
The development must link the change to faster delivery of water and a shorter lag time. Do not credit 'it makes the lag time shorter' alone for both marks.
Question 3
3 marks
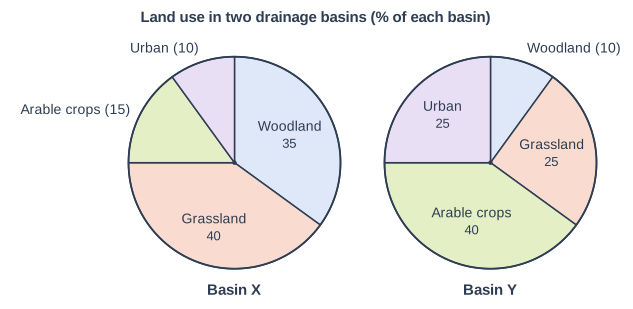
Study Figure 1, which shows land use in two neighbouring drainage basins of similar size, X and Y (data written for this course).
Compare land use in Basin X with land use in Basin Y.
Model answer
Basin X has much more woodland than Basin Y: 35% compared with only 10%. Basin Y has much more urban land, 25% compared with 10%, two and a half times as much. Grassland is the largest land use in Basin X (40%), but arable crops are the largest in Basin Y (40%).
Explanation
Each mark needs a statement about both basins, such as 'more than' or 'two and a half times as much', ideally with data. Reasons for the differences are not credited because the command word is Compare.
Mark scheme
1 mark
A valid comparative point, e.g. Basin X has much more woodland than Basin Y (35% against 10%, three and a half times as much)
Award 1 mark for each different comparative point, up to 3. Valid comparisons: Basin X has much more woodland (35% against 10%, three and a half times as much); Basin Y has much more urban land (25% against 10%, two and a half times as much); Basin Y has more arable land (40% against 15%, over twice as much); Basin X has more grassland (40% against 25%); grassland is the largest land use in Basin X but arable crops are the largest in Basin Y; urban land is the smallest use in Basin X but woodland is the smallest in Basin Y. Comparisons may use data or manipulated data (e.g. 'Basin Y has 15 percentage points more urban land'). Do not credit explanation. Do not credit data lifted for one basin only without a comparison.
1 mark
A second, different comparative point, e.g. Basin Y has two and a half times as much urban land as Basin X (25% against 10%)
Must be a different comparison from the one already credited, using the list above.
1 mark
A third, different comparative point, e.g. grassland is the largest land use in Basin X but arable crops are the largest in Basin Y
Must be different from both of the other comparisons credited.
Question 4
4 marks
Explain how building a large housing estate on the flood plain of a river can increase the flood risk for places further downstream.
Model answer
The estate replaces fields with impermeable roofs, roads and pavements. Rain cannot infiltrate, so it is collected by storm drains and delivered to the river within minutes. This makes the lag time shorter and the peak discharge higher. The extra water arrives at places downstream at the same time as the rest of the flood, so the river is more likely to rise above bankfull and flood them. Building on the flood plain also removes land where floodwater used to spread out and be stored, so even more water is passed downstream.
Explanation
The first mark is for the change the estate makes; further marks come from a chain of linked steps ending in higher flood risk downstream. Answers that describe only the estate itself flooding miss the focus on downstream areas.
Mark scheme
1 mark
Identifies a relevant change, e.g. the estate creates impermeable surfaces (roofs, roads) / it removes flood plain land that used to store floodwater
Award one mark for identifying a change and up to three further marks for linked development. Example chain: Roofs and roads are impermeable (1); rain cannot infiltrate and is collected by storm drains (1); drains deliver it to the river much faster, so the lag time is shorter and the peak higher (1); the higher, earlier peak passes downstream and can exceed bankfull discharge, flooding places below the estate (1). Alternative chain: building on the flood plain removes space where water spread out and was stored in floods (1); the water is kept in the channel (1), so more water travels downstream at once (1), raising the flood peak there (1). Accept any other appropriate response, including defences built to protect the estate pushing water downstream.
3 marks
Up to three further marks for linked development leading to higher flood risk downstream
Each development mark must add a new linked step. Do not credit the risk to the people living on the estate itself; the question is about places downstream.
Ready to try the rest? Every answer you write is marked against the mark scheme, so you can see exactly where the marks are.
Ctrl + Enter to check
Study HelperHints first, answers after you try
Stuck on this one? Ask for a hint and I’ll point you in the right direction, without giving the answer away. Once you’ve checked your answer, I’ll show you how the marks are awarded.