Coastal fieldwork: data, conclusions and evaluation
Practise 26 exam-style questions on Coastal fieldwork: data, conclusions and evaluation for Edexcel GCSE Geography B (Paper 2). Write your answer as you would in the exam and get it marked in seconds against the mark scheme, point by point, with the Study Helper on hand if you get stuck.
26 questions
1–8 marks each
Instant marking
No sign-up needed
20 questions, marked as you go
Sample questions with model answers
Here are 4 of the questions in this topic, each with a model answer, an explanation of why it earns the marks and the mark scheme an examiner would use.
Question 1
1 mark
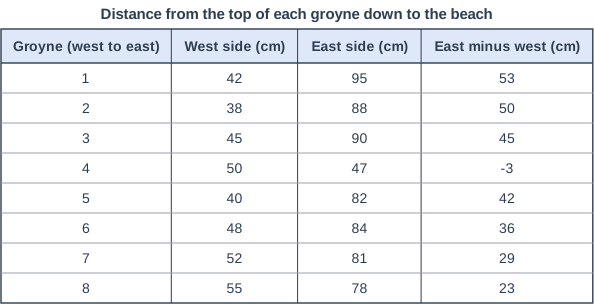
A group of students measured the distance from the top of each of eight groynes down to the beach, 1 m from the groyne on its west and east sides. Figure 1 shows their results (written for this course).
Calculate the median of the 'east minus west' differences for the eight groynes.
Model answer
In order: -3, 23, 29, 36, 42, 45, 50, 53 Median = (4th value + 5th value) ÷ 2 = (36 + 42) ÷ 2 = 39 cm
Explanation
Put the eight values in order; with an even number of values the median is the mean of the two middle values, here the 4th and 5th. The median (39 cm) is higher than the mean (about 34 cm) because the negative value at Groyne 4 pulls the mean down. Forgetting to put the values in order first is the most common error.
Mark scheme
1 mark
39 cm ((36 + 42) ÷ 2 = 39)
Accept 39 or 39 cm. Correct answer with no working scores full marks. In order the differences are -3, 23, 29, 36, 42, 45, 50, 53; with eight values the median is halfway between the 4th and 5th values. Do not credit 36 or 42 (one middle value only, or the median with Groyne 4 left out), 34 or 34.4 (the mean) or 19.5 (the 4th and 5th values in the table, -3 and 42, without putting the values in order).
Question 2
2 marks
A group of students collected data on beach width, sediment size and people's views at sites along a coast with sea walls and groynes.
Explain one way in which a geographical information system (GIS) could help them present the results of their investigation.
Model answer
GIS would let the students plot their beach widths and pebble sizes as a layer on an aerial image of the coast, at the exact place each was measured. This would show whether the beach changes where the groynes end or where the sea wall starts, linking the results to the management.
Explanation
One mark is for a way GIS presents the data, such as mapping results as layers on an aerial image, and one for explaining what this helps the students see. The strength of GIS is linking data to location and to other layers. Simply saying a computer makes graphs earns nothing.
Mark scheme
1 mark
Identifies a valid use of GIS for presenting the results
Examples: The results can be plotted as layers on a digital map or aerial image at the exact location of each site (1) so patterns along the coast can be seen next to the sea walls and groynes that may have caused them (1). Layers such as geology, flood risk or the Shoreline Management Plan policy can be added on top of the results (1) so the students can see whether the results change where the geology or the management changes (1). Aerial images from different years can be shown with the results (1) so changes in the beach or cliff line over time can be compared with the fieldwork data (1). Photographs, field sketches and interview quotations can be linked to points on the map (1) so qualitative and quantitative data for each site can be seen together (1). Accept any other appropriate response.
1 mark
Develops the point, explaining how it helps the presentation or analysis
Do not credit 'it is on a computer' or 'it looks professional' without saying what it shows.
Question 3
3 marks
A group of students asked residents and visitors how successful new rock armour has been at protecting a cliff top. Figure 1 shows the results (written for this course).
Compare the views of residents and visitors shown in Figure 1.
Use data from Figure 1 in your answer.
Model answer
Visitors were slightly more positive than residents: about 79% of visitors (22 of 28) said the rock armour was very or quite successful, compared with about 72% of residents (23 of 32). Visitors were also much more likely to say 'very successful' (about 43% against 28%). A larger share of residents were negative, with about 28% saying not very or not at all successful compared with about 21% of visitors.
Explanation
Each mark needs a comparison that refers to both groups, ideally using percentages because the groups are different sizes. Without data the answer can score at most 2. Suggesting why residents and visitors hold different views is explanation, which the question does not ask for.
Mark scheme
3 marks
1 mark for each valid comparative point, up to 3 marks
Max 2 if no data from Figure 1 is used. Examples: A higher proportion of visitors than residents thought the rock armour was successful: 22 of 28 visitors (about 79%) compared with 23 of 32 residents (about 72%) (1). Visitors were more likely to say 'very successful': 12 of 28 (about 43%) compared with 9 of 32 residents (about 28%) (1). A larger share of residents were negative: 9 of 32 (about 28%) said not very or not at all successful, compared with 6 of 28 visitors (about 21%) (1). Most people in both groups thought the scheme was very or quite successful (1). 'Quite successful' was the most common answer for residents but 'very successful' was the most common for visitors (1). Comparisons of raw numbers alone (e.g. '12 visitors and 9 residents said very successful') may be credited, but the best answers use percentages because the groups are different sizes. Award marks for comparative statements only, not for describing one group. Do not credit explanation. Accept any other appropriate response.
Question 4
4 marks
A group of students concluded that a new sea wall has reduced flooding in a seaside town.
Explain two ways in which secondary data could help them to check this conclusion.
Model answer
1. Newspaper reports from before and after the wall was built would show how often the town flooded. If floods were reported often before the wall but rarely since, this would support the conclusion. 2. Met Office storm records would show whether there have been strong storms and high tides since the wall was built. If there have, and the town did not flood, this is stronger evidence that the wall is working rather than the weather simply being calm.
Explanation
Each way earns 1 mark for a secondary source and 1 for explaining how it would test the conclusion. Good answers choose sources that compare flooding before and after the wall, or check whether there have been storms that would have caused flooding. Primary methods, such as asking residents, are not secondary data.
Mark scheme
1 mark
First way: identifies a secondary source and how it could be used
Examples: Newspaper reports or council records of flooding (1) could show whether the town flooded less often after the wall was built than before (1). Records of storms, high tides or storm surges from the Met Office or a tide gauge (1) would show whether there have been big storms since the wall was built, so that fewer floods are not just because of calm weather (1). Environment Agency flood maps or flood warning records (1) could show whether the area at risk of flooding from the sea has been reduced by the wall (1). Insurance claims or the council's reports on the scheme (1) could show whether flood damage to homes and businesses has fallen (1). The Shoreline Management Plan or the scheme's planning documents (1) would show what the wall was designed to protect against, so the students can judge whether it has met its aims (1). Accept any other appropriate response.
1 mark
Develops the first way
The development must explain how the source would confirm or challenge the conclusion.
1 mark
Second way: identifies a different secondary source or use
The two ways must be different. Do not credit primary methods (e.g. interviewing residents, measuring the beach, field sketches).
1 mark
Develops the second way
As for the first way.
Ready to try the rest? Every answer you write is marked against the mark scheme, so you can see exactly where the marks are.
Ctrl + Enter to check
Study HelperHints first, answers after you try
Stuck on this one? Ask for a hint and I’ll point you in the right direction, without giving the answer away. Once you’ve checked your answer, I’ll show you how the marks are awarded.