Level:
Correct: 0
Incorrect: 0
Marks: 0/0
Exam Practice
Course:
Topics:
Edexcel GCSE Geography B (Paper 2) Smart practice A mixed round aimed at your weak spots
Unit 4
Topic 4: The UK's evolving physical landscape
Unit 5
Topic 5: The UK's evolving human landscape
Unit 6
Topic 6: Geographical investigations
Avg
score:
–
Topics
done:
0/28

River fieldwork: data, conclusions and evaluation

Practise 25 exam-style questions on River fieldwork: data, conclusions and evaluation for Edexcel GCSE Geography B (Paper 2). Write your answer as you would in the exam and get it marked in seconds against the mark scheme, point by point, with the Study Helper on hand if you get stuck.

  • 25 questions
  • 1–8 marks each
  • Instant marking
  • No sign-up needed
20 questions, marked as you go

Sample questions with model answers

Here are 4 of the questions in this topic, each with a model answer, an explanation of why it earns the marks and the mark scheme an examiner would use.

Question 1

1 mark

Figure 1 shows channel measurements made by a group of students at two sites on a river (data written for this course).

Hydraulic radius = cross-sectional area ÷ wetted perimeter

Calculate the hydraulic radius at Site 2, shown as X in Figure 1. Answer to two decimal places.
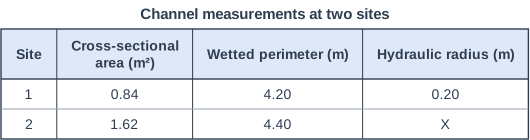
Channel measurements at two sites. Table with columns "Site", "Cross-sectional area (m²)", "Wetted perimeter (m)", "Hydraulic radius (m)". Site: 1; Cross-sectional area (m²): 0.84; Wetted perimeter (m): 4.20; Hydraulic radius (m): 0.20 | Site: 2; Cross-sectional area (m²): 1.62; Wetted perimeter (m): 4.40; Hydraulic radius (m): X.

Model answer

1.62 ÷ 4.40 = 0.368 = 0.37 m

Explanation

Divide the cross-sectional area by the wetted perimeter. Site 2 has a larger hydraulic radius than Site 1 (0.20 m), so less of its water is in contact with the bed and banks; it is a more efficient channel with less friction. A common error is to divide the wrong way round.

Mark scheme
  1. 1 mark

    0.37 m (1.62 ÷ 4.40 = 0.368)

    Correct answer is 0.37. Accept 0.37 with or without units. Correct answer with no working scores full marks. Do not accept 0.368 or 0.4 (not two decimal places), or 2.72 (wetted perimeter divided by area).
Question 2

2 marks

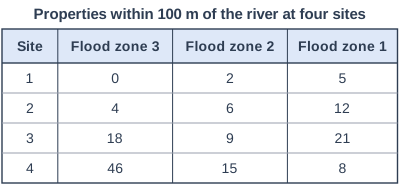
Figure 1 shows the number of properties within 100 m of a river in each flood zone at four sites (data written for this course). A student plans to present these data as four pie charts, one for each site, all drawn the same size.

Explain one weakness of presenting the data in this way.

Properties within 100 m of the river at four sites. Table with columns "Site", "Flood zone 3", "Flood zone 2", "Flood zone 1". Site: 1; Flood zone 3: 0; Flood zone 2: 2; Flood zone 1: 5 | Site: 2; Flood zone 3: 4; Flood zone 2: 6; Flood zone 1: 12 | Site: 3; Flood zone 3: 18; Flood zone 2: 9; Flood zone 1: 21 | Site: 4; Flood zone 3: 46; Flood zone 2: 15; Flood zone 1: 8.

Model answer

All four pie charts would be the same size, even though Site 4 has 69 properties within 100 m of the river and Site 1 has only 7. The charts would show only the proportion of properties in each flood zone, so the much larger number of properties at risk at Site 4 would be hidden. Proportional circles, sized by the total at each site, would avoid this.

Explanation

Pie charts show each category as a share of a total. When the totals are very different, pie charts of the same size hide the differences in the numbers, which matters in an investigation about how many properties are at risk. One mark is for the weakness and one for explaining its effect, ideally with data from Figure 1.

Mark scheme
  1. 1 mark

    A valid weakness, e.g. pie charts of the same size hide the very different numbers of properties at the sites / pie charts show only proportions, not the number of properties at risk / it is hard to compare sector sizes between four separate pie charts

    Figure evidence: the totals are 7 properties (Site 1), 22 (Site 2), 48 (Site 3) and 69 (Site 4); the share in flood zone 3 is 0%, about 18%, about 38% and about 67%. Examples: All four pie charts would be the same size even though Site 4 has 69 properties and Site 1 only 7 (1), so the much larger number of properties at risk at Site 4 would be hidden (1). Pie charts show proportions, not numbers (1), so the 46 properties in flood zone 3 at Site 4 would not be shown, although the number of properties at risk is what matters for flood risk to property (1). It is hard to compare the sizes of sectors in four separate pie charts (1), so it would be difficult to see how the share of properties in flood zone 3 increases from Site 1 to Site 4; a divided bar chart would show this more clearly (1). Accept any other appropriate response.

  2. 1 mark

    Development explaining the effect of the weakness on what the presentation shows, ideally with data from Figure 1 (e.g. Site 1, with 7 properties, would look as important as Site 4, with 69)

    Do not credit general points that do not apply to this plan, e.g. 'pie charts take a long time to draw'.

Question 3

3 marks

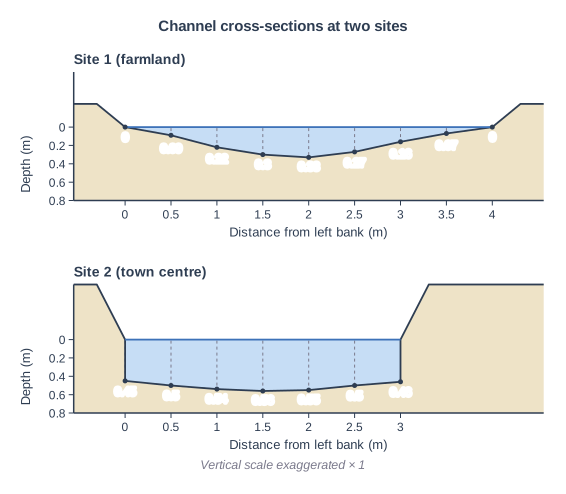
Figure 1 shows channel cross-sections measured by a group of students at two sites on the same river (data written for this course). Site 1 is in farmland and Site 2 is in a town centre.

Compare the channel at Site 1 with the channel at Site 2.

You must use data in your answer.

Channel cross-sections at two sites. Two river channel cross-sections one above the other, drawn to the same scales: "Site 1 (farmland)" (top) and "Site 2 (town centre)" (bottom). Each is drawn as a graph: the horizontal axis is "Distance from left bank (m)" (numbered every 0.5 m) and the vertical axis "Depth (m)" runs downwards from 0 at the water surface (numbered every 0.2 m to 0.8 m). The water (blue) fills the channel below a level water surface between the water's edges; the bed is drawn through a dot at each depth reading, with a dashed line from the surface down to each dot; the banks rise above the water on each side. The vertical scale is exaggerated × 1 (printed under the figure). "Site 1 (farmland)": Depth readings every 0.5 m across a width of 4 m: 0, 0.09, 0.22, 0.3, 0.33, 0.27, 0.16, 0.07, 0 m; the banks rise about 0.25 m above the water surface. The depth values are printed under the dots. "Site 2 (town centre)": Depth readings every 0.5 m across a width of 3 m: 0.45, 0.5, 0.54, 0.56, 0.55, 0.5, 0.46 m; the banks rise about 0.6 m above the water surface. The depth values are printed under the dots.

Model answer

Site 2 is narrower than Site 1, at 3.0 m compared with 4.0 m. However, Site 2 is much deeper, with a maximum depth of 0.56 m compared with 0.33 m. Site 2 also has vertical sides and is 0.45 m deep right at its edges, whereas Site 1 has gently sloping banks and becomes 0 m deep at each edge, so Site 2 has the larger cross-sectional area.

Explanation

Each mark needs a comparison of the two sites, supported by data from the figure, such as width, maximum depth or the shape of the sides. Explanations, for example that the town channel has been walled to reduce flooding, are not credited in a Compare question.

Mark scheme
  1. 3 marks

    1 mark for each valid comparative point, up to 3 marks, e.g. Site 2 is narrower than Site 1 (3.0 m compared with 4.0 m) / Site 2 is deeper (maximum 0.56 m compared with 0.33 m) / Site 2 is deep right up to its edges (0.45-0.46 m), whereas Site 1 shallows to 0 m at both edges / Site 2 has a flatter bed with depths all between 0.45 and 0.56 m, while Site 1 varies from 0 to 0.33 m / Site 2 has vertical sides but Site 1 has gently sloping banks / Site 2 has the larger cross-sectional area (about 1.5 m² compared with about 0.7 m²)

    Max 2 if no data from Figure 1 is used.
    Each point must compare the two sites (e.g. 'narrower', 'deeper', 'whereas'); separate descriptions of each site earn credit only when a comparison is clear. Data manipulation is credited, e.g. 'Site 2 is 1 m narrower' or 'the maximum depth at Site 2 is 0.23 m greater'. Accept areas from any sensible method (Site 1 about 0.6-0.8 m², Site 2 about 1.5 m²). Widths read from the distance axis within plus or minus 0.25 m (half the interval between its marks) of those given are acceptable. Do not credit explanation, e.g. why the town channel has walls.

Question 4

4 marks

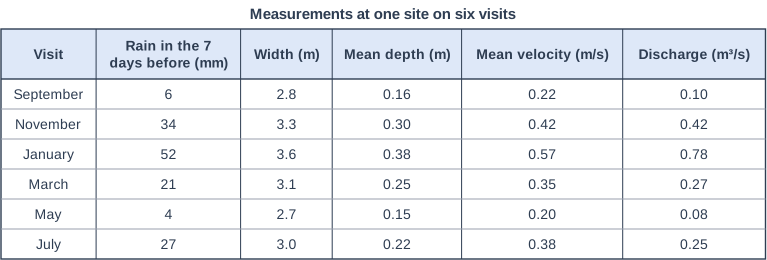
Figure 1 shows measurements made by a group of students at the same site on a river on six visits during one year (data written for this course).

The students expected the discharge on each visit to depend only on the amount of rain that fell in the 7 days before it.

Using Figure 1, explain two factors, other than the rain in the 7 days before a visit, that could affect the discharge at this site.

Measurements at one site on six visits. Table with columns "Visit", "Rain in the 7 days before (mm)", "Width (m)", "Mean depth (m)", "Mean velocity (m/s)", "Discharge (m³/s)". Visit: September; Rain in the 7 days before (mm): 6; Width (m): 2.8; Mean depth (m): 0.16; Mean velocity (m/s): 0.22; Discharge (m³/s): 0.10 | Visit: November; Rain in the 7 days before (mm): 34; Width (m): 3.3; Mean depth (m): 0.30; Mean velocity (m/s): 0.42; Discharge (m³/s): 0.42 | Visit: January; Rain in the 7 days before (mm): 52; Width (m): 3.6; Mean depth (m): 0.38; Mean velocity (m/s): 0.57; Discharge (m³/s): 0.78 | Visit: March; Rain in the 7 days before (mm): 21; Width (m): 3.1; Mean depth (m): 0.25; Mean velocity (m/s): 0.35; Discharge (m³/s): 0.27 | Visit: May; Rain in the 7 days before (mm): 4; Width (m): 2.7; Mean depth (m): 0.15; Mean velocity (m/s): 0.20; Discharge (m³/s): 0.08 | Visit: July; Rain in the 7 days before (mm): 27; Width (m): 3.0; Mean depth (m): 0.22; Mean velocity (m/s): 0.38; Discharge (m³/s): 0.25.

Model answer

1. The season affects how much of the rain reaches the river. July had more rain than March (27 mm compared with 21 mm) but a lower discharge (0.25 compared with 0.27 m³/s). In summer, higher temperatures and growing plants mean more of the rain is evaporated, intercepted or taken up by plants, and dry soils soak up more of it, so less runs off into the river.
2. How wet the ground already was also matters. By January the soil was probably saturated after weeks of winter rain, so most of the rain ran straight off into the river. January had about 1.5 times November's rain (52 mm compared with 34 mm) but almost twice its discharge (0.78 compared with 0.42 m³/s).

Explanation

Discharge depends on how much rain reaches the river and how quickly, not only on the 7-day rain total. Each factor earns a mark and its explanation a second; the best answers use the July and March figures from Figure 1 as evidence. Answers that only repeat that more rain gives more discharge do not answer the question.

Mark scheme
  1. 1 mark

    First factor, e.g. the season (evaporation, transpiration and interception by plants) / how wet the ground already was (saturated soil, antecedent conditions) / when and how heavily the rain fell within the 7 days / the amount of groundwater (base flow) / snowmelt or rain elsewhere in the drainage basin

    Max 3 if no data or evidence from Figure 1 is used.
    Figure evidence: July had more rain than March (27 mm compared with 21 mm) but a lower discharge (0.25 compared with 0.27 m³/s); January had about 1.5 times November's rain (52 mm compared with 34 mm) but almost twice its discharge (0.78 compared with 0.42 m³/s). Examples: In July plants are growing and temperatures are higher (1), so more of the rain is intercepted, taken up by plants or evaporated before it reaches the river, which is why July had a lower discharge (0.25 m³/s) than March (0.27 m³/s) despite more rain (1). In winter the ground is often already saturated after rain in earlier weeks (1), so more of the rain runs off into the river; January's discharge (0.78 m³/s) was almost twice November's although its rain was only about 1.5 times greater (1). The 7-day total does not show when the rain fell (1): heavy rain on the day before a visit raises discharge much more than the same amount a week earlier, when the river may already have fallen back towards base flow (1). In winter the water table is higher, so more groundwater seeps into the river as base flow (1), keeping discharge higher than the recent rain alone would suggest (1). Accept any other appropriate response.

  2. 1 mark

    Explanation of how the first factor affects discharge

  3. 1 mark

    Second, different factor

    The two factors must be different. Do not credit answers that only say that more rain gives more discharge.

  4. 1 mark

    Explanation of how the second factor affects discharge

Ready to try the rest? Every answer you write is marked against the mark scheme, so you can see exactly where the marks are.

Study Helper Hints first, answers after you try

Stuck on this one? Ask for a hint and I’ll point you in the right direction, without giving the answer away. Once you’ve checked your answer, I’ll show you how the marks are awarded.