Level:
Correct: 0
Incorrect: 0
Marks: 0/0
Exam Practice
Course:
Topics:
Edexcel GCSE Geography B (Paper 2) Smart practice A mixed round aimed at your weak spots
Unit 4
Topic 4: The UK's evolving physical landscape
Unit 5
Topic 5: The UK's evolving human landscape
Unit 6
Topic 6: Geographical investigations
Avg
score:
–
Topics
done:
0/28

Coastal landscapes of deposition: spits, beaches and bars

Practise 26 exam-style questions on Coastal landscapes of deposition: spits, beaches and bars for Edexcel GCSE Geography B (Paper 2). Write your answer as you would in the exam and get it marked in seconds against the mark scheme, point by point, with the Study Helper on hand if you get stuck.

  • 26 questions
  • 1–8 marks each
  • Instant marking
  • No sign-up needed
20 questions, marked as you go

Sample questions with model answers

Here are 4 of the questions in this topic, each with a model answer, an explanation of why it earns the marks and the mark scheme an examiner would use.

Question 1

1 mark

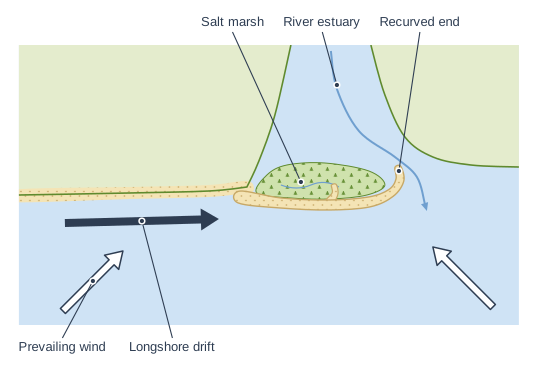
Study Figure 1, which shows the results of a survey at six sites along a shingle beach on an imaginary coast (data written for this course). Site 1 is at the western end of the beach and Site 6 at the eastern end.

Calculate the range of the mean pebble lengths at the six sites.
Beach survey at six sites from west to east. Table with columns "Site", "Distance from Site 1 (km)", "Mean pebble length (mm)", "Mean roundness (1 = angular, 6 = well rounded)", "Beach width (m)". Site: 1; Distance from Site 1 (km): 0; Mean pebble length (mm): 64; Mean roundness (1 = angular, 6 = well rounded): 2.1; Beach width (m): 18 | Site: 2; Distance from Site 1 (km): 1; Mean pebble length (mm): 55; Mean roundness (1 = angular, 6 = well rounded): 2.6; Beach width (m): 22 | Site: 3; Distance from Site 1 (km): 2; Mean pebble length (mm): 49; Mean roundness (1 = angular, 6 = well rounded): 3.0; Beach width (m): 25 | Site: 4; Distance from Site 1 (km): 3; Mean pebble length (mm): 41; Mean roundness (1 = angular, 6 = well rounded): 3.4; Beach width (m): 31 | Site: 5; Distance from Site 1 (km): 4; Mean pebble length (mm): 33; Mean roundness (1 = angular, 6 = well rounded): 3.9; Beach width (m): 36 | Site: 6; Distance from Site 1 (km): 5; Mean pebble length (mm): 26; Mean roundness (1 = angular, 6 = well rounded): 4.4; Beach width (m): 45.

Model answer

64 - 26 = 38 mm

Explanation

The range is the largest value minus the smallest value: 64 mm at Site 1 minus 26 mm at Site 6. A common error is to write the two values ('26 to 64') instead of working out the difference.

Mark scheme
  1. 1 mark

    38 (mm)

    64 - 26 = 38. Accept 38 or 38 mm. Correct answer with no working scores the mark. Do not accept '26 to 64' or '26-64' given as two values, or 38 with wrong units (e.g. 38 cm).
Question 2

2 marks

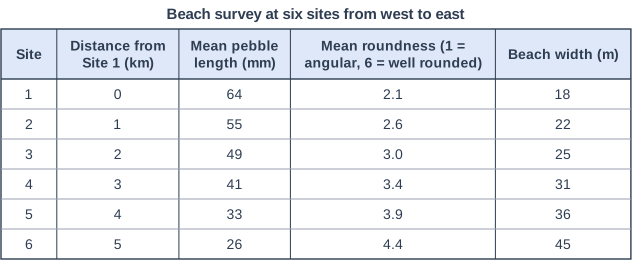
Study Figure 1, which shows the length of an imaginary spit between 1900 and 2020 (data written for this course).

Calculate the mean rate at which the spit grew between 1980 and 2020, in metres per year.

Answer to one decimal place. Show your working.

Length of a spit, 1900-2020. Line graph of length of spit in km (y-axis, 1 to 1.6) against year (x-axis, 1900 to 2020). The line joins the points (1900, 1.1), (1920, 1.21), (1940, 1.33), (1960, 1.46), (1980, 1.2), (2000, 1.36), (2020, 1.54).

Model answer

Length in 2020 = 1.54 km; length in 1980 = 1.20 km
Increase = 0.34 km = 340 m
340 ÷ 40 = 8.5 m per year

Explanation

Read the two lengths from the graph, find the increase, convert it from kilometres to metres and divide by the 40 years. Common errors are forgetting to convert to metres (giving 0.0085) or dividing by the wrong number of years.

Mark scheme
  1. 1 mark

    Method: (1.54 - 1.20) km = 0.34 km = 340 m, ÷ 40 years (correct answer 8.5 m per year)

    Correct answer (8.5) with no working scores both marks. If the answer is wrong or not given to one decimal place, award 1 mark for a correct method using readings within the accepted ranges (see the answer mark): the increase in length (converted to metres) divided by 40. An answer of 0.0085 (km per year) shows a correct method but the wrong units: award 1 mark.

  2. 1 mark

    Answer: 8.5 (m per year)

    Accept readings from 1.19 to 1.21 km (1980) and from 1.53 to 1.55 km (2020), half a gridline either side of the plotted values. Award this mark for the answer worked correctly, to one decimal place, from the student's own readings within these ranges: answers from 8.0 to 9.0, e.g. 8.5 from 1.20 and 1.54. Must be given to one decimal place: do not credit 9 or 8.50 for this mark.

Question 3

3 marks

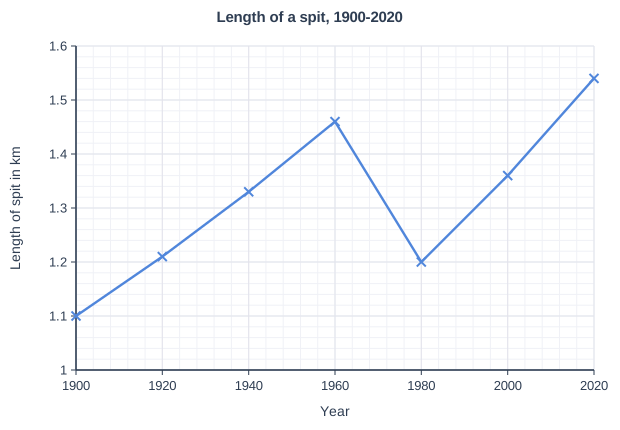
Study Figure 1, which shows two profiles of the same beach, measured in June and in the following January (data written for this course).

Compare the June profile with the January profile.

Use data from Figure 1 in your answer.

Profiles of the same beach in June and January. A beach profile drawn from fieldwork readings, as a graph of "Height (m)" (vertical axis, numbered every 1 m from −1 to 4) against "Distance from the sea (m)" (horizontal axis, numbered every 5 m from 0 to 40). The sea is shown at the left, level with the start of the profile; the profile runs from the sea's edge (distance 0) up the beach to the right as straight lines joining a dot at each ranging pole position, with the beach shaded below it. The vertical scale is exaggerated × 4 (printed under the graph). Two profiles are drawn on the same axes, with a key: "June" (solid black line, black dots) and "January" (dashed orange line, open orange dots). "June": 6 readings from the sea up the beach (distance between poles, clinometer angle; + is uphill away from the sea, − downhill): 1) 6 m at +3°, 2) 6 m at +5°, 3) 5 m at +10°, 4) 8 m at +1°, 5) 6 m at +6°, 6) 4 m at +8°; pole positions (distance from the sea, height): pole 1 0 m, 0 m; pole 2 6 m, 0.31 m; pole 3 12 m, 0.84 m; pole 4 17 m, 1.71 m; pole 5 25 m, 1.84 m; pole 6 31 m, 2.47 m; pole 7 35 m, 3.03 m. "January": 6 readings from the sea up the beach (distance between poles, clinometer angle; + is uphill away from the sea, − downhill): 1) 10 m at +2°, 2) 8 m at +3°, 3) 6 m at +5°, 4) 5 m at +14°, 5) 4 m at −6°, 6) 3 m at +8°; pole positions (distance from the sea, height): pole 1 0 m, 0 m; pole 2 10 m, 0.35 m; pole 3 18 m, 0.77 m; pole 4 24 m, 1.29 m; pole 5 29 m, 2.5 m; pole 6 33 m, 2.08 m; pole 7 36 m, 2.5 m.

Model answer

The June profile is higher than the January profile over most of the beach: 17 m from the sea it is about 1.7 m high in June, but at 18 m in January it is only about 0.8 m. In June there is a flat berm between about 17 and 25 m, whereas in January there is no berm but a steep ridge about 2.5 m high at 29 m, with a dip behind it. At the back of the beach the June profile reaches about 3.0 m at 35 m, higher than the January profile, which ends at about 2.5 m.

Explanation

Each mark needs a comparison of the two profiles, using readings of height or distance from the graph. Explanations of why the beach changed are not credited in a Compare question.

Mark scheme
  1. 1 mark

    A comparative statement, e.g. the June profile is higher over most of the beach (about 1.7 m at 17 m from the sea in June compared with about 0.8 m at 18 m in January)

    Max 2 if no data from Figure 1 is used. Award 1 mark for each comparative statement, up to 3. Data may be readings, differences or angles. Readings within half a gridline (plus or minus 0.5 m in height and 2.5 m in distance) of the values given are acceptable. Do not credit explanation (e.g. reasons for the changes). Do not credit data lifts about one profile only, with no comparison.

  2. 1 mark

    A second comparative statement, e.g. June has a flat berm (between about 17 and 25 m from the sea) whereas January has no berm but a ridge at about 29 m (2.5 m high) with a dip behind it

    Other comparisons: the lower beach is gentler in January (2-3° over the first 18 m) than in June (3-5°, then 10°) (1); the steepest section is steeper in January (14°) than in June (10°) (1); the top of the profile is higher in June (about 3.0 m at 35 m) than in January (about 2.5 m) (1); both profiles rise from the sea to between about 2.5 and 3 m at the back of the beach (1).

  3. 1 mark

    A third comparative statement

    Accept any other valid comparative statement supported by Figure 1.

Question 4

4 marks

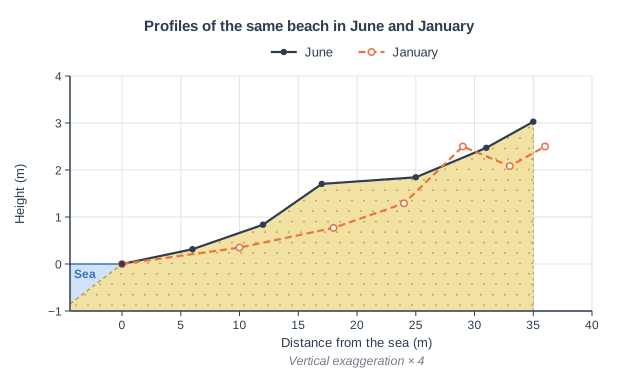
Figure 1 shows a spit.

Explain how the spit shown in Figure 1 was formed.

Plan view of a stretch of coast with an estuary. Plan view: land at the top and the sea at the bottom. The coast on the left runs from left to right, then turns inland where a river flows down between two areas of land and out to sea. A thick arrow in the sea points along the coast on the left towards the river mouth. From the corner where the coast turns inland, a long, narrow strip of sand stretches out across the river mouth; its tip curves back towards the land, and a smaller hook sticks out part-way along it. Behind the strip of sand, in the sheltered water, is an area marked with grass symbols. Two open arrows point diagonally towards the coast: one from the bottom left and one from the bottom right, towards the tip of the strip of sand. The label "Longshore drift" points to the thick arrow in the sea pointing along the coast towards the estuary; the label "Prevailing wind" points to the open arrow at the bottom left, pointing diagonally towards the coast; the label "River estuary" points to the curved arrow flowing down between the two areas of land and out to sea; the label "Salt marsh" points to the area with grass symbols in the sheltered water behind the long, narrow strip of sand; the label "Recurved end" points to the hooked tip of the long, narrow strip of sand, curving back towards the land.

Model answer

The prevailing wind drives waves towards the coast at an angle, so longshore drift carries sand and shingle along the coast towards the estuary. Where the coastline changes direction and turns inland at the estuary, the drift carries on in the same direction, and the sediment is deposited in the more sheltered water. Over time this builds a long, narrow ridge of sand and shingle out across the mouth of the estuary. Secondary winds and waves from another direction (from the bottom right of Figure 1) push the end round, forming the recurved end, and salt marsh develops in the sheltered water behind the spit. The flow of the river keeps the mouth of the estuary open, so the spit does not grow right across.

Explanation

The core of the answer is longshore drift carrying sediment along the coast and deposition where the coastline changes direction. Further marks come from explaining how the spit grows, why the end curves and why it does not cross the estuary. Simply describing what the diagram shows does not explain the formation.

Mark scheme
  1. 1 mark

    Identifies a first stage, e.g. the prevailing wind drives waves at an angle, so longshore drift moves sediment along the coast towards the estuary

    Award marks for each correct, linked stage, up to 4 in total. Examples: Waves approach the coast at an angle, driven by the prevailing wind, so longshore drift moves sand and shingle along the coast (1). Where the coastline changes direction at the estuary (1), the drift continues and the sediment is deposited in the more sheltered water, building a ridge out across the mouth of the estuary (1). The spit grows longer as more sediment is added to its end (1). Secondary winds and waves from another direction curve the end, forming a recurved end (1). The river's flow keeps the estuary mouth open, so the spit does not join the other side (1); salt marsh forms in the sheltered water behind it (1). Accept any other appropriate response.

  2. 3 marks

    Up to 3 further marks for linked stages: deposition where the coastline changes direction (1); the ridge grows out across the estuary (1); a secondary wind curves the end / salt marsh forms behind / the river keeps the mouth open (1)

    Credit the stages in any wording. The answer must include longshore drift and deposition for full marks.

Ready to try the rest? Every answer you write is marked against the mark scheme, so you can see exactly where the marks are.

Study Helper Hints first, answers after you try

Stuck on this one? Ask for a hint and I’ll point you in the right direction, without giving the answer away. Once you’ve checked your answer, I’ll show you how the marks are awarded.