
Level:
Correct: 0
Incorrect: 0
Marks: 0/0
Exam Practice
Course:
Topics:
Edexcel GCSE Geography B (Paper 2) Smart practice A mixed round aimed at your weak spots
Unit 4
Topic 4: The UK's evolving physical landscape
Unit 5
Topic 5: The UK's evolving human landscape
Unit 6
Topic 6: Geographical investigations
Avg
score:
–
Topics
done:
0/28

A major UK city: site, situation and structure

Practise 25 exam-style questions on A major UK city: site, situation and structure for Edexcel GCSE Geography B (Paper 2). Write your answer as you would in the exam and get it marked in seconds against the mark scheme, point by point, with the Study Helper on hand if you get stuck.

  • 25 questions
  • 1–12 marks each
  • Instant marking
  • No sign-up needed
20 questions, marked as you go

Sample questions with model answers

Here are 4 of the questions in this topic, each with a model answer, an explanation of why it earns the marks and the mark scheme an examiner would use.

Question 1

1 mark

Study Figure 1, which shows the results of a survey at six sites along a transect from the CBD of a UK city. The data were written for this course. The environmental quality score is out of 40.

Calculate the median environmental quality score for the six sites.
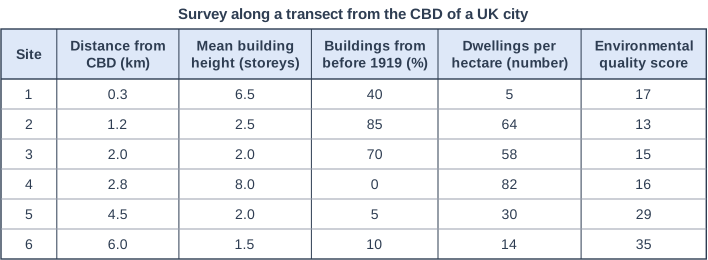
Survey along a transect from the CBD of a UK city. Table with columns "Site", "Distance from CBD (km)", "Mean building height (storeys)", "Buildings from before 1919 (%)", "Dwellings per hectare (number)", "Environmental quality score". Site: 1; Distance from CBD (km): 0.3; Mean building height (storeys): 6.5; Buildings from before 1919 (%): 40; Dwellings per hectare (number): 5; Environmental quality score: 17 | Site: 2; Distance from CBD (km): 1.2; Mean building height (storeys): 2.5; Buildings from before 1919 (%): 85; Dwellings per hectare (number): 64; Environmental quality score: 13 | Site: 3; Distance from CBD (km): 2.0; Mean building height (storeys): 2.0; Buildings from before 1919 (%): 70; Dwellings per hectare (number): 58; Environmental quality score: 15 | Site: 4; Distance from CBD (km): 2.8; Mean building height (storeys): 8.0; Buildings from before 1919 (%): 0; Dwellings per hectare (number): 82; Environmental quality score: 16 | Site: 5; Distance from CBD (km): 4.5; Mean building height (storeys): 2.0; Buildings from before 1919 (%): 5; Dwellings per hectare (number): 30; Environmental quality score: 29 | Site: 6; Distance from CBD (km): 6.0; Mean building height (storeys): 1.5; Buildings from before 1919 (%): 10; Dwellings per hectare (number): 14; Environmental quality score: 35.

Model answer

In order: 13, 15, 16, 17, 29, 35
Median = (16 + 17) ÷ 2 = 16.5

Explanation

Put the six scores in order and find the middle: with an even number of values the median is halfway between the two middle values (16 and 17). A common error is to work out the mean (about 20.8) instead of the median, or to forget to order the values first.

Mark scheme
  1. 1 mark

    16.5

    Accept 16.5 only. Correct answer with no working scores full marks. Working: scores in order 13, 15, 16, 17, 29, 35; the median is halfway between the 3rd and 4th values: (16 + 17) ÷ 2 = 16.5. Common errors: 16 or 17 (only one middle value), 20.8 (the mean), 22 (the range).
Question 2

2 marks

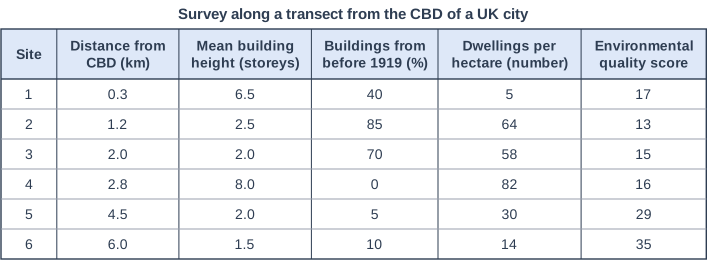
Study Figure 1, which shows the results of a survey at six sites along a transect from the CBD of a UK city. The data were written for this course.

Suggest one enquiry question that a student could investigate by carrying out fieldwork along a transect like this one.

Survey along a transect from the CBD of a UK city. Table with columns "Site", "Distance from CBD (km)", "Mean building height (storeys)", "Buildings from before 1919 (%)", "Dwellings per hectare (number)", "Environmental quality score". Site: 1; Distance from CBD (km): 0.3; Mean building height (storeys): 6.5; Buildings from before 1919 (%): 40; Dwellings per hectare (number): 5; Environmental quality score: 17 | Site: 2; Distance from CBD (km): 1.2; Mean building height (storeys): 2.5; Buildings from before 1919 (%): 85; Dwellings per hectare (number): 64; Environmental quality score: 13 | Site: 3; Distance from CBD (km): 2.0; Mean building height (storeys): 2.0; Buildings from before 1919 (%): 70; Dwellings per hectare (number): 58; Environmental quality score: 15 | Site: 4; Distance from CBD (km): 2.8; Mean building height (storeys): 8.0; Buildings from before 1919 (%): 0; Dwellings per hectare (number): 82; Environmental quality score: 16 | Site: 5; Distance from CBD (km): 4.5; Mean building height (storeys): 2.0; Buildings from before 1919 (%): 5; Dwellings per hectare (number): 30; Environmental quality score: 29 | Site: 6; Distance from CBD (km): 6.0; Mean building height (storeys): 1.5; Buildings from before 1919 (%): 10; Dwellings per hectare (number): 14; Environmental quality score: 35.

Model answer

How does environmental quality change with distance from the CBD?

Explanation

A good enquiry question names something that can be measured in the field and links it to a second variable, often distance from the CBD, so that the data can show a pattern. A question with a focus but no relationship earns 1 mark.

Mark scheme
  1. 1 mark

    A question focused on a characteristic of the city that can be measured or observed along the transect, e.g. environmental quality / building age / building height / housing density / land use / pedestrian numbers / noise

    Examples: 'How does environmental quality change with distance from the CBD?' (2). 'Does housing density decrease as you move away from the city centre?' (2). 'Is environmental quality higher where housing density is lower?' (2). 'What is the environmental quality like in the inner city?' (1: a clear focus but no relationship). A testable hypothesis written as a statement with the same clear relationship can also be credited. Accept any other appropriate response.

  2. 1 mark

    A clear and legitimate relationship with a second variable or with location, e.g. change with distance from the CBD

    The relationship must be one that could actually be investigated with fieldwork data. Do not credit questions that cannot be answered by collecting data along the transect (e.g. 'Why do people like living in the suburbs?' with no measurable focus).

Question 3

3 marks

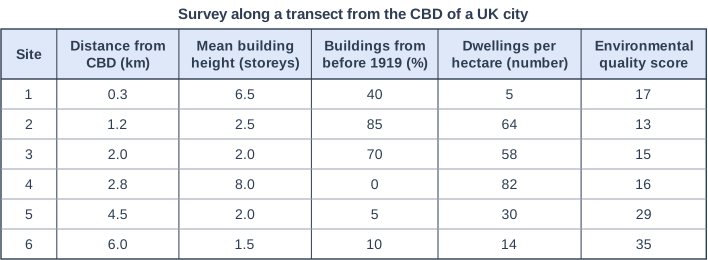
Study Figure 1, which shows the results of a survey at six sites along a transect from the CBD of a UK city. The data were written for this course. The environmental quality score is out of 40.

Compare the characteristics of Site 2 with those of Site 5.

Use data from Figure 1 in your answer.

Survey along a transect from the CBD of a UK city. Table with columns "Site", "Distance from CBD (km)", "Mean building height (storeys)", "Buildings from before 1919 (%)", "Dwellings per hectare (number)", "Environmental quality score". Site: 1; Distance from CBD (km): 0.3; Mean building height (storeys): 6.5; Buildings from before 1919 (%): 40; Dwellings per hectare (number): 5; Environmental quality score: 17 | Site: 2; Distance from CBD (km): 1.2; Mean building height (storeys): 2.5; Buildings from before 1919 (%): 85; Dwellings per hectare (number): 64; Environmental quality score: 13 | Site: 3; Distance from CBD (km): 2.0; Mean building height (storeys): 2.0; Buildings from before 1919 (%): 70; Dwellings per hectare (number): 58; Environmental quality score: 15 | Site: 4; Distance from CBD (km): 2.8; Mean building height (storeys): 8.0; Buildings from before 1919 (%): 0; Dwellings per hectare (number): 82; Environmental quality score: 16 | Site: 5; Distance from CBD (km): 4.5; Mean building height (storeys): 2.0; Buildings from before 1919 (%): 5; Dwellings per hectare (number): 30; Environmental quality score: 29 | Site: 6; Distance from CBD (km): 6.0; Mean building height (storeys): 1.5; Buildings from before 1919 (%): 10; Dwellings per hectare (number): 14; Environmental quality score: 35.

Model answer

Site 2 has a much higher proportion of old buildings than Site 5, with 85% built before 1919 compared with only 5%. Site 2 is also more than twice as densely built, with 64 dwellings per hectare compared with 30. Environmental quality at Site 2 is much lower, scoring 13 out of 40 compared with 29 at Site 5.

Explanation

Each mark needs a comparative statement about both sites, supported by data from the table. Listing the values for each site separately, or explaining why the sites differ, does not earn marks. Without any data the answer is limited to 2 marks.

Mark scheme
  1. 1 mark

    A first valid comparative statement, e.g. Site 2 has a much higher proportion of old buildings than Site 5 (85% from before 1919 compared with 5%)

    Max 2 if no data from Figure 1 is used. Award one mark for each comparative point, up to 3. Creditable comparisons: Site 2 has far more old buildings (85% v 5% from before 1919) (1). Site 2 is more than twice as densely built (64 v 30 dwellings per hectare) (1). Buildings at Site 2 are slightly taller (2.5 v 2.0 storeys) (1). Environmental quality is much lower at Site 2 (13 v 29, less than half) (1). Site 2 is closer to the CBD (1.2 km v 4.5 km) (1). Credit data manipulation, e.g. 'Site 2 has 34 more dwellings per hectare' or 'a score 16 lower'. Accept any other appropriate comparison.

  2. 1 mark

    A second, different comparative statement

    Do not credit data lifts directly from the figure: each mark needs a comparison (higher, lower, more, less, twice as ...), not two separate descriptions.

  3. 1 mark

    A third, different comparative statement

    Do not credit explanation of the differences (e.g. why the inner city is denser).

Question 4

4 marks

Explain one advantage and one disadvantage of living in the inner city of a major UK city.

Model answer

Advantage: the inner city is close to the CBD, so people can walk, cycle or take a short bus ride to work, which saves time and money compared with commuting from the suburbs.

Disadvantage: heavy traffic on the main roads causes air pollution and noise, which can harm residents' health, for example by making asthma worse.

Explanation

One mark each is for identifying an advantage and a disadvantage, and one each for explaining how it affects residents. Two advantages, or two disadvantages, cannot score full marks.

Mark scheme
  1. 1 mark

    Identifies an advantage, e.g. close to jobs in the CBD / good access to public transport and services / housing is often cheaper than nearer the centre / lively cultural and community facilities

    Examples: The inner city is close to the CBD (1) so people can walk, cycle or take a short bus ride to work, saving time and money (1). There is good public transport and many shops and services nearby (1) so people do not need a car (1). Older terraced housing and flats can be cheaper to rent than in many other areas (1) which suits young people and students (1). Accept any other appropriate response.

  2. 1 mark

    Develops the advantage

    The development must explain how the feature benefits residents.

  3. 1 mark

    Identifies a disadvantage, e.g. poor air quality, noise and traffic / little green space / overcrowded or poor-condition housing / higher deprivation in some areas

    Examples: Heavy traffic causes air pollution and noise (1) which can harm residents' health, for example causing breathing problems (1). There is little green space because buildings are densely packed (1) so children have fewer places to play and exercise (1). Some housing is old, damp or overcrowded (1) which can affect health and children's schoolwork (1). Accept any other appropriate response.

  4. 1 mark

    Develops the disadvantage

    Avoid crediting stereotypes about the people who live in an area; credit points about the environment, housing and services.

Ready to try the rest? Every answer you write is marked against the mark scheme, so you can see exactly where the marks are.

Study Helper Hints first, answers after you try

Stuck on this one? Ask for a hint and I’ll point you in the right direction, without giving the answer away. Once you’ve checked your answer, I’ll show you how the marks are awarded.