Practise 26 exam-style questions on Rural fieldwork: enquiry questions and methods for Edexcel GCSE Geography B (Paper 2). Write your answer as you would in the exam and get it marked in seconds against the mark scheme, point by point, with the Study Helper on hand if you get stuck.
26 questions
1–8 marks each
Instant marking
No sign-up needed
20 questions, marked as you go
Sample questions with model answers
Here are 4 of the questions in this topic, each with a model answer, an explanation of why it earns the marks and the mark scheme an examiner would use.
Question 1
1 mark
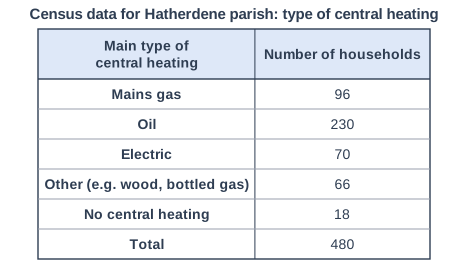
Figure 1 shows census data on the main type of central heating in households in Hatherdene, an imaginary rural parish (data written for this course). Homes that are not connected to mains gas often have higher heating costs.
Calculate the percentage of households in Hatherdene that do not use mains gas for their central heating.
Model answer
480 - 96 = 384 384 ÷ 480 × 100 = 80%
Explanation
Subtract the mains-gas households from the total (or add the other four groups) and divide by the total number of households. Many rural homes are not connected to the gas network, so they rely on oil, electricity or other fuels, which can make heating expensive and is one cause of fuel poverty. A common error is to give the percentage that does use mains gas.
Mark scheme
1 mark
80%
480 - 96 = 384 households do not use mains gas; 384 ÷ 480 × 100 = 80%. Accept 80 or 80%. Do not accept 20% (the share that does use mains gas) or 76.25% (366 ÷ 480, which wrongly leaves out the households with no central heating). Correct answer with no working scores full marks.
Question 2
2 marks
You have carried out your own fieldwork investigating how and why deprivation varies within rural areas in the UK.
Explain one way in which you used census data to plan your fieldwork.
Model answer
We looked at census data for the output areas around our school and found that one village had 18% of households with no car or van while another had only 6%. We chose these two villages so that our results were likely to show a clear contrast in deprivation.
Explanation
Credit any use of census data that shaped the plan: choosing places, sharing out the sample or writing a hypothesis, followed by how it helped. A common error is to describe using census data only after the fieldwork, or to name information the census does not collect, such as household income.
Mark scheme
1 mark
Identifies a valid way census data was used in planning, e.g. to choose contrasting villages or areas / to decide on sample sizes / to write a hypothesis
Answers will vary with the centre's fieldwork; credit any valid enquiry, location, method and result. Do not penalise the absence of a named fieldwork location. Examples: We compared the percentage of households with no car or van in different output areas (1) so we could choose villages likely to show contrasting levels of deprivation (1). We used the number of households in each village (1) to share our questionnaires in proportion, so the sample was stratified (1). Census data showed a high share of people aged 65 and over in one village (1), so we wrote a hypothesis about access to healthcare for older residents (1). Accept any other appropriate response.
1 mark
Develops the way, showing how it shaped the fieldwork plan
Uses after the data were collected (e.g. checking results) are not planning: credit them only if linked to a planning decision. Do not credit data the census does not collect, e.g. income or bus frequency.
Question 3
3 marks
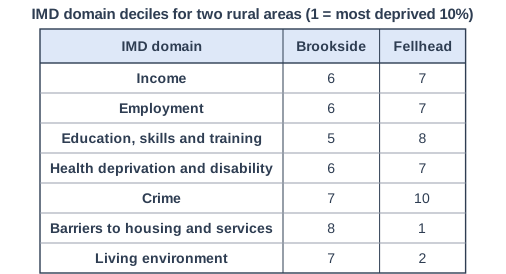
Figure 1 shows the Index of Multiple Deprivation (IMD) decile for each domain in two imaginary rural areas, Brookside and Fellhead (data written for this course). Decile 1 is the most deprived 10% of areas in England and decile 10 is the least deprived 10%.
Compare the deprivation in Brookside and Fellhead shown in Figure 1.
Model answer
Fellhead is much more deprived than Brookside for barriers to housing and services (decile 1 compared with 8) and for the living environment (decile 2 compared with 7). However, Brookside is more deprived for education, skills and training (decile 5 compared with 8) and for crime (7 compared with 10). Overall, Fellhead's deciles vary far more, from 1 to 10, whereas Brookside's are all between 5 and 8.
Explanation
Each mark needs a comparison of the two areas, using the deciles correctly: decile 1 is the most deprived. Good answers notice that the two areas are deprived in different ways rather than one being worse in every domain. Reasons for the differences are not credited in a Compare question.
Mark scheme
3 marks
Award 1 mark for each valid comparative point, up to 3 marks, e.g. Fellhead is far more deprived than Brookside for barriers to housing and services (decile 1 compared with 8) / Fellhead is more deprived for living environment (decile 2 compared with 7) / Brookside is more deprived than Fellhead for education, skills and training (decile 5 compared with 8) / Brookside is more deprived for crime (7 compared with 10) / Brookside is slightly more deprived for income, employment and health (6 compared with 7 in each) / Fellhead's deciles vary much more (from 1 to 10) whereas Brookside's are all between 5 and 8
Award marks for comparative statements (whereas, but, more, less), not for separate descriptions of each area. Remember that a LOWER decile means MORE deprived: answers that read the deciles the wrong way round are not credited. Data may be used or manipulated (e.g. differences in deciles) to score marks. Do not credit data lifts directly from the figure without comparison. Do not credit explanation, e.g. 'because Fellhead is remote'.
Question 4
4 marks
Explain two ways in which bus timetables could be used as secondary data in an investigation into how deprivation varies within a rural area.
Model answer
First, the students could count the buses each weekday from each village to the market town, because villages with only a few buses leave people without a car isolated from jobs and services. Second, they could find the time of the last bus home from the town, which shows whether residents without a car can work later shifts or go to evening classes, an important part of access to opportunities.
Explanation
Each way needs a clear use of the timetables and a development explaining how it shows access to services or deprivation. Good answers use measures such as frequency, the last bus and journey time. A common error is to say 'to see how many buses there are' without linking this to deprivation.
Mark scheme
1 mark
First way, e.g. count the buses each day from each village / compare evening, weekend or Sunday services / work out journey times to the nearest town, hospital or college / check whether buses run at times people need for work or school
Examples: Count the number of buses each weekday from each village to the nearest town (1), so villages with the poorest public transport, where people without a car are most isolated, can be identified (1). Find the time of the last bus home (1), which shows whether residents without a car can work evening shifts or attend evening activities in town (1). Work out the journey time to the nearest hospital or college (1), giving a measure of access to services that can be compared with distance (1). Compare timetables with residents' questionnaire answers about transport (1), to check whether their views match the service actually provided (1). Accept any other appropriate response.
1 mark
Develops the first way, linking it to deprivation or access to services
1 mark
Second, different way
The two ways must be different; counting weekday and Saturday buses counts once unless a clear difference in purpose is explained.
1 mark
Develops the second way
Ready to try the rest? Every answer you write is marked against the mark scheme, so you can see exactly where the marks are.
Ctrl + Enter to check
Study HelperHints first, answers after you try
Stuck on this one? Ask for a hint and I’ll point you in the right direction, without giving the answer away. Once you’ve checked your answer, I’ll show you how the marks are awarded.