
Level:
Correct: 0
Incorrect: 0
Marks: 0/0
Exam Practice
Course:
Topics:
Edexcel GCSE Geography B (Paper 2) Smart practice A mixed round aimed at your weak spots
Unit 4
Topic 4: The UK's evolving physical landscape
Unit 5
Topic 5: The UK's evolving human landscape
Unit 6
Topic 6: Geographical investigations
Avg
score:
–
Topics
done:
0/28

A major UK city and its accessible rural area

Practise 25 exam-style questions on A major UK city and its accessible rural area for Edexcel GCSE Geography B (Paper 2). Write your answer as you would in the exam and get it marked in seconds against the mark scheme, point by point, with the Study Helper on hand if you get stuck.

  • 25 questions
  • 1–12 marks each
  • Instant marking
  • No sign-up needed
20 questions, marked as you go

Sample questions with model answers

Here are 4 of the questions in this topic, each with a model answer, an explanation of why it earns the marks and the mark scheme an examiner would use.

Question 1

1 mark

Study Figure 1, which shows the distance from a city, Marlbridge, and the percentage of working residents who commute to the city, for 14 villages (data written for this course).

Identify the village in Figure 1 that does not fit the general pattern.
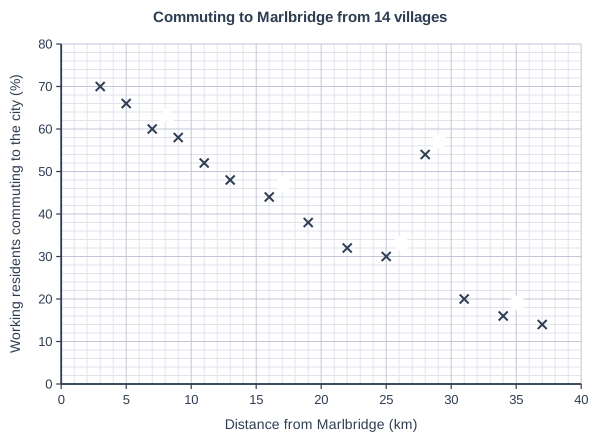
Commuting to Marlbridge from 14 villages. Scatter graph on a grid of small squares. The horizontal axis is "Distance from Marlbridge (km)", from 0 to 40, numbered every 5, with 5 small squares between numbered values (each small square is 1). The vertical axis is "Working residents commuting to the city (%)", from 0 to 80, numbered every 10, with 5 small squares between numbered values (each small square is 2). 14 points are plotted as crosses: (3, 70), (5, 66), (9, 58), (11, 52), (13, 48), (19, 38), (22, 32), (31, 20) and (37, 14), plus a point labelled A, a point labelled B, a point labelled C, a point labelled D and a point labelled E. (The labelled points' coordinates can be read from the grid.)

Model answer

D

Explanation

The general pattern is a strong negative correlation: the further a village is from the city, the smaller the percentage of its workers who commute there. Village D is much further away than villages with a similar percentage, so it is the anomaly; it might, for example, have a railway station with fast trains to the city.

Mark scheme
  1. 1 mark

    D

    Village D is 28 km from Marlbridge but 54% of its working residents commute to the city, far more than other villages at similar distances (e.g. C at 25 km has 30%). Accept 'D' or a description that clearly identifies the point at 28 km and 54%. Do not credit more than one letter.
Question 2

2 marks

Explain one reason why demand for housing from people who work in a city can increase house prices in villages in its accessible rural area.

Model answer

People with well-paid jobs in the city can afford to pay more for village houses than local people on lower rural wages, so sellers can ask higher prices, which pushes up house prices across the village.

Explanation

Prices rise when demand is greater than supply, so the development should explain the competition for a limited number of homes or the higher incomes of city buyers. Saying only that more people want to live there is not enough.

Mark scheme
  1. 1 mark

    Identifies a valid reason, e.g. more buyers than homes for sale / city workers earn higher salaries / planning limits (green belt) restrict new building / buyers from the city have money from selling city homes

    Examples: Many city workers want to live in villages (1), but there are few homes for sale, so buyers compete and prices are pushed up (1). People with well-paid city jobs can afford to pay more (1) than local people on lower rural wages, so sellers raise their prices (1). Green belt rules limit new house building (1), so the supply of homes cannot rise to meet demand (1). Accept any other appropriate response.

  2. 1 mark

    Develops the reason (how it pushes prices up)

    Do not credit 'more people want to live there' with no link to supply or ability to pay.

Question 3

3 marks

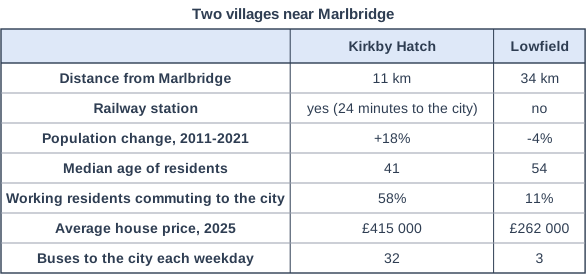
Study Figure 1, which shows information about two villages near the city of Marlbridge (data written for this course).

Compare Kirkby Hatch and Lowfield.

Use data from Figure 1 in your answer.

Two villages near Marlbridge. Table with columns (row headings), "Kirkby Hatch", "Lowfield". Distance from Marlbridge; Kirkby Hatch: 11 km; Lowfield: 34 km | Railway station; Kirkby Hatch: yes (24 minutes to the city); Lowfield: no | Population change, 2011-2021; Kirkby Hatch: +18%; Lowfield: -4% | Median age of residents; Kirkby Hatch: 41; Lowfield: 54 | Working residents commuting to the city; Kirkby Hatch: 58%; Lowfield: 11% | Average house price, 2025; Kirkby Hatch: £415 000; Lowfield: £262 000 | Buses to the city each weekday; Kirkby Hatch: 32; Lowfield: 3.

Model answer

Kirkby Hatch's population grew by 18% between 2011 and 2021, whereas Lowfield's fell by 4%. A much higher proportion of Kirkby Hatch's working residents commute to the city, 58% compared with only 11% in Lowfield, more than five times as many. Lowfield's residents are older, with a median age of 54 compared with 41, while houses in Kirkby Hatch cost £153 000 more on average (£415 000 against £262 000).

Explanation

Each mark needs a statement that compares the two villages, ideally using the data or a difference worked out from it. Writing about each village separately, or explaining why they differ (for example because of the railway station), does not earn extra marks.

Mark scheme
  1. 1 mark

    One comparative point, e.g. Kirkby Hatch's population grew (+18%) whereas Lowfield's fell (-4%)

    Max 2 if no data from Figure 1 is used. Award 1 mark for each comparative point, up to 3 marks. Points must compare the two villages ('whereas', 'higher than'); separate descriptions with no comparison score 1 mark at most. Data manipulation (e.g. differences or ratios) counts as use of data. Do not credit explanation.

  2. 1 mark

    A second comparative point, e.g. a much higher share of Kirkby Hatch's working residents commute to the city (58% v 11%, more than five times as many) / Lowfield's residents are older (median age 54 v 41, 13 years older)

  3. 1 mark

    A third comparative point, e.g. houses in Kirkby Hatch cost £153 000 more on average (£415 000 v £262 000) / Kirkby Hatch has far more buses (32 v 3 a day) and a railway station whereas Lowfield has no station / Kirkby Hatch is 23 km closer to the city (11 km v 34 km)

    Accept any other valid comparison from Figure 1.

Question 4

4 marks

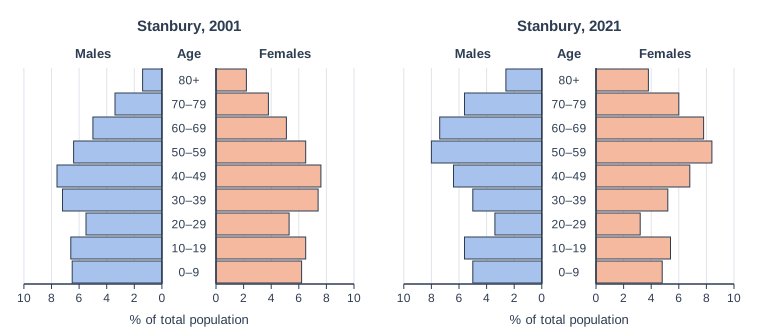
Study Figure 1, which shows the population structure of Stanbury, a village 15 km from a city, in 2001 and 2021 (data written for this course).

Using Figure 1, suggest two reasons for the changes in the population structure of Stanbury between 2001 and 2021.

Two population pyramids side by side on the same scale: "Stanbury, 2001" (left) and "Stanbury, 2021" (right). Each has horizontal bars for males (blue, to the left) and females (orange, to the right) of a central column of age groups, from 0–9 at the bottom to 80+ at the top. The horizontal scale is "% of total population", from 0 at the centre to 10 at each side, numbered every 2. Stanbury, 2001: (males, females): 0–9: 6.5, 6.2; 10–19: 6.6, 6.5; 20–29: 5.5, 5.3; 30–39: 7.2, 7.4; 40–49: 7.6, 7.6; 50–59: 6.4, 6.5; 60–69: 5, 5.1; 70–79: 3.4, 3.8; 80+: 1.4, 2.2 (%). Stanbury, 2021: (males, females): 0–9: 5, 4.8; 10–19: 5.6, 5.4; 20–29: 3.4, 3.2; 30–39: 5, 5.2; 40–49: 6.4, 6.8; 50–59: 8, 8.4; 60–69: 7.4, 7.8; 70–79: 5.6, 6; 80+: 2.6, 3.8 (%).

Model answer

First, the proportion of people aged 20-39 fell from about 25% to about 17%. This is probably because house prices in a village so close to the city are too high for young adults, who move to the city for university, jobs and cheaper rented flats.

Second, the proportion aged 60 and over rose from about 21% to about 33%. Many people who moved to Stanbury as commuters in earlier decades have stayed and grown older, and the village's quiet environment also attracts people when they retire.

Explanation

Each reason should be linked to a change shown in the pyramids (fewer young adults and children, more older people) and developed with a plausible explanation such as house prices, out-migration of young adults or retirement. Describing the changes without suggesting reasons earns little.

Mark scheme
  1. 1 mark

    First reason linked to a change shown, e.g. young adults (20-39) have left / older people (50+) have moved in or aged in place / fewer children (0-9)

    Max 3 if no evidence from Figure 1 is used. Changes: aged 20-39 fell from about 25% to about 17% of the population; aged 60+ rose from about 21% to about 33%; aged 0-9 fell from about 13% to about 10%; 50-59 became the largest group. Readings within half a gridline (plus or minus 1 percentage point) of each bar are acceptable, and totals worked from the student's own readings are credited. Examples: Young adults aged 20-39 fell from about 25% to 17% (1) because house prices are too high for them and they move to the city for jobs, university or cheaper flats (1). The share aged 60 and over rose from about 21% to 33% (1) as people who moved to the village as commuters decades ago have stayed and grown older, and retired people move in for its quiet environment (1). There are fewer children aged 0-9 (1) because there are fewer young adults of child-bearing age living in the village (1). Accept any other appropriate response.

  2. 1 mark

    Develops the first reason

  3. 1 mark

    Second, different reason linked to a change shown

    The two reasons must be different.

  4. 1 mark

    Develops the second reason

    Do not credit description of the changes without a reason.

Ready to try the rest? Every answer you write is marked against the mark scheme, so you can see exactly where the marks are.

Study Helper Hints first, answers after you try

Stuck on this one? Ask for a hint and I’ll point you in the right direction, without giving the answer away. Once you’ve checked your answer, I’ll show you how the marks are awarded.