
Level:
Correct: 0
Incorrect: 0
Marks: 0/0
Exam Practice
Course:
Topics:
Edexcel GCSE Geography B (Paper 2) Smart practice A mixed round aimed at your weak spots
Unit 4
Topic 4: The UK's evolving physical landscape
Unit 5
Topic 5: The UK's evolving human landscape
Unit 6
Topic 6: Geographical investigations
Avg
score:
–
Topics
done:
0/28

River fieldwork: enquiry questions and methods

Practise 25 exam-style questions on River fieldwork: enquiry questions and methods for Edexcel GCSE Geography B (Paper 2). Write your answer as you would in the exam and get it marked in seconds against the mark scheme, point by point, with the Study Helper on hand if you get stuck.

  • 25 questions
  • 1–8 marks each
  • Instant marking
  • No sign-up needed
20 questions, marked as you go

Sample questions with model answers

Here are 4 of the questions in this topic, each with a model answer, an explanation of why it earns the marks and the mark scheme an examiner would use.

Question 1

1 mark

Figure 1 is a flood map of part of an imaginary town, drawn in the style of an Environment Agency flood map (written for this course). Flood zone 3 has the highest chance of flooding from the river.

Identify which one of the following statements is supported by Figure 1.

Choose your answer.

  • A Part of the housing area is in flood zone 3.
  • B None of the park is in flood zone 3.
  • C All of the industrial area is in flood zone 3.
  • D The A684 does not cross flood zone 3.
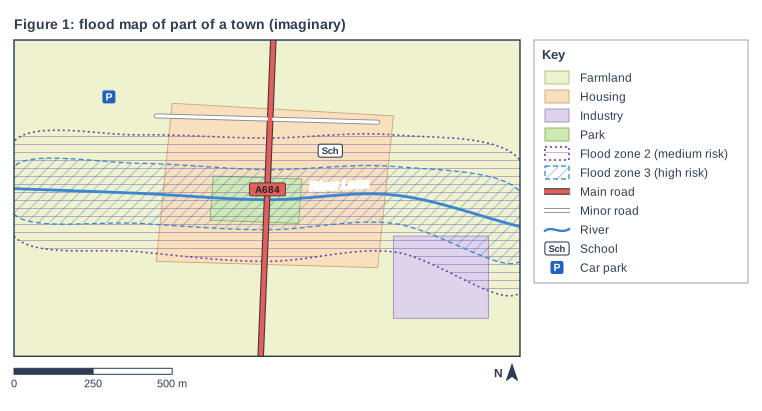
Figure 1: flood map of part of a town (imaginary). Map of a local area, 1.6 km from west to east and 1 km from south to north, with north at the top. Areas: the farmland shown pale yellow-green, covering the whole map; the housing area shown pale orange, in the centre of the map; the industrial area shown pale purple, in the south-east of the map; the park shown green, in the centre of the map; the flood zone 2 (medium risk) shown purple hatching with a dotted purple outline, in the centre of the map; the flood zone 3 (high risk) shown blue diagonal hatching with a dashed blue outline, in the centre of the map. Lines: the River Lenn (a river, blue, named) runs from the west edge to the east edge, passing through the centre of the map; the A684 (main road) runs from the south edge to the north edge, passing through the centre of the map; a minor road runs from the north-west of the map to the north-east of the map, passing through the north of the map. Symbols: the school in the centre of the map (inside the farmland, the housing area and the flood zone 2 (medium risk)); the car park in the north-west of the map (inside the farmland). The key (beside the map) shows: farmland, housing, industry, park, flood zone 2 (medium risk), flood zone 3 (high risk), main road, minor road, river, Sch = school, P = car park. Below the map: a scale bar marked 0, 250 and 500 m and a north arrow pointing to the top.

Model answer

A

Explanation

A flood map shows the land that could be flooded from a river or the sea; flood zone 3 is the highest-risk zone. Read the key carefully and check which land uses and roads lie inside each hatched area. Common errors are to treat the whole town as at risk, or to mix up flood zones 2 and 3.

Mark scheme
  1. 1 mark

    A (Part of the housing area is in flood zone 3.)

    Accept the letter or the option written out; do not credit more than one answer. A is correct: the blue-hatched flood zone 3 runs along the river through the middle of the housing area. B is incorrect: the park lies beside the river and is entirely inside flood zone 3. C is incorrect: most of the industrial area lies south of flood zone 3; only its north-east corner is inside it. D is incorrect: the A684 crosses the river, so it passes through flood zone 3.
Question 2

2 marks

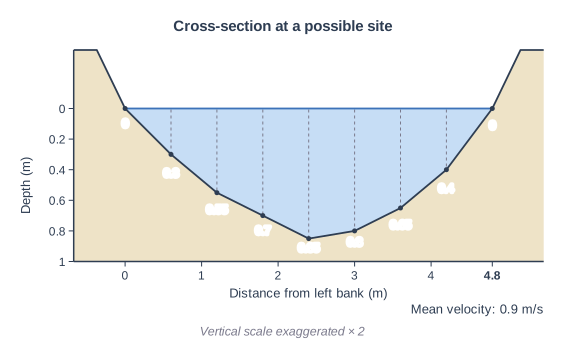
A group of students made a reconnaissance (pilot) visit to a possible fieldwork site on a river. Figure 1 shows the channel cross-section they recorded (data written for this course). Their risk assessment says that students may only stand in water that is less than 0.5 m deep.

Using Figure 1, explain one reason why the students should not measure the channel by wading across the river at this site.

Cross-section at a possible site. A river channel cross-section drawn to scale from fieldwork readings. It is drawn as a graph: the horizontal axis is "Distance from left bank (m)" (numbered every 1 m) and the vertical axis "Depth (m)" runs downwards from 0 at the water surface (numbered every 0.2 m to 1 m). The water (blue) fills the channel below a level water surface between the water's edges; the bed is drawn through a dot at each depth reading, with a dashed line from the surface down to each dot; the banks rise above the water on each side. The vertical scale is exaggerated × 2 (printed under the figure). Depth readings every 0.6 m across a width of 4.8 m: 0, 0.3, 0.55, 0.7, 0.85, 0.8, 0.65, 0.4, 0 m; the banks rise about 0.38 m above the water surface. The depth values are printed under the dots. "Mean velocity: 0.9 m/s" is printed under the cross-section.

Model answer

The water is deeper than the 0.5 m limit across most of the channel, reaching 0.85 m in the middle, and it is flowing fast (0.9 m/s). A student wading across could lose their footing and be swept downstream, so the students should choose a shallower site or take their measurements from a bridge.

Explanation

Risk assessments for river fieldwork limit the depth and speed of water that students may enter. Good answers use the depths or the velocity in Figure 1 to show that this site breaks the limit, then explain the danger or what the students should do instead. A general comment that rivers are dangerous does not use the figure.

Mark scheme
  1. 1 mark

    A reason using evidence from Figure 1, e.g. the water is deeper than 0.5 m across more than half of the channel / the maximum depth is 0.85 m / the mean velocity is fast (0.9 m/s)

    Figure evidence: five of the seven depths measured in the water are more than 0.5 m (0.55, 0.70, 0.85, 0.80 and 0.65 m), so the water is too deep from about 1.1 m to about 4.0 m from the left bank, about 60% of the 4.8 m width; the deepest reading is 0.85 m; the mean velocity is 0.9 m/s. Positions read from the distance axis within about 0.5 m (half the interval between its numbered marks) of those given are acceptable. Examples: The water is deeper than 0.5 m across most of the channel and reaches 0.85 m in the middle (1), so a student wading across would break the risk assessment and could lose their footing and be swept downstream (1). The mean velocity is 0.9 m/s, which is fast for a small river (1), so in water up to 0.85 m deep the current could knock a student over (1). The middle of the channel is 0.85 m deep (1), so the students could not reach the far bank safely and should choose a shallower site or measure from a bridge instead (1). Accept any other appropriate response.

  2. 1 mark

    Development explaining the danger to the students or what they should do instead

    A general statement that rivers are dangerous, with no evidence from Figure 1, earns no marks.

Question 3

2 marks

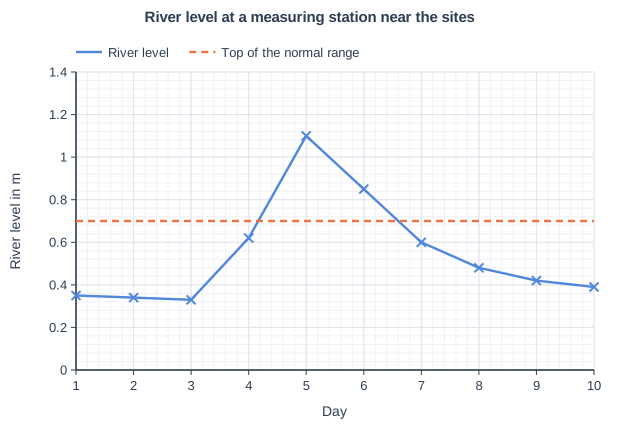
Figure 1 shows river levels recorded at a measuring station near a group of students' fieldwork sites (data written for this course). The students carried out their fieldwork on day 6.

Using Figure 1, explain one way in which the river level data could affect how the students interpret their results.

River level at a measuring station near the sites. Line graph of river level in m (y-axis, 0 to 1.4) against day (x-axis, 1 to 10). "River level" joins the points (1, 0.35), (2, 0.34), (3, 0.33), (4, 0.62), (5, 1.1), (6, 0.85), (7, 0.6), (8, 0.48), (9, 0.42), (10, 0.39). "Top of the normal range" (dashed) joins the points (1, 0.7), (10, 0.7).

Model answer

On day 6 the river level was about 0.85 m, above the top of the normal range of 0.7 m, and it was still falling after the peak on day 5. The students measured the river when it was higher and faster than usual, so their results are not typical of normal conditions, and sites measured later in the day may have had less water than earlier ones.

Explanation

Secondary data from a measuring station put one day of fieldwork in context. The best answers use the graph (the level on day 6 compared with the normal range, and the falling trend) and explain the effect on how typical or comparable the results are.

Mark scheme
  1. 1 mark

    A valid point using Figure 1, e.g. on day 6 the level (about 0.85 m) was above the top of the normal range (0.7 m) / the level was falling after a peak of about 1.1 m on day 5

    Examples: On day 6 the river level was about 0.85 m, above the top of the normal range (0.7 m) (1), so the students' depths, velocities and discharges are higher than usual and not typical of the river (1). The level was falling on day 6 after a peak of 1.1 m on day 5 (1), so sites measured later in the day may show less water than earlier ones, making comparisons between sites less fair (1). Because the river was higher than normal (1), the results show the channel closer to bankfull, which is useful for judging flood risk but not for describing normal conditions (1). Readings within half a gridline (plus or minus 0.02 m) of the values given are acceptable, e.g. 0.83 to 0.87 m on day 6 and 1.08 to 1.12 m on day 5. Accept any other appropriate response.

  2. 1 mark

    Development explaining the effect on how typical or comparable the results are

Question 4

4 marks

A group of students used a qualitative method, such as field sketches or annotated photographs, to collect data on factors that might influence flood risk at each site along a river.

Explain two factors that the students could record.

Model answer

1. The land use beside the river, such as houses and shops built on the flood plain. More buildings close to the river means more people and property would be affected if it flooded.
2. Impermeable surfaces such as roads and car parks. Rain cannot soak into them, so it runs quickly into the river, which makes the river rise faster and increases the risk of flooding.

Explanation

Each factor earns 1 mark and its link to flood risk earns a second. The factors must be things that can be seen and recorded at a site, which is what qualitative methods do well. Channel measurements such as depth are quantitative and are not credited here.

Mark scheme
  1. 1 mark

    First factor that can be observed and recorded at a site

    Examples: Land use on the flood plain, e.g. houses or businesses close to the river (1), because more property and people would be affected if the river overflowed (1). Impermeable surfaces such as roads, car parks and roofs (1), because rain runs off them quickly into the river, raising the peak discharge (1). Flood defences, e.g. walls or embankments, and their condition (1), because they hold more water in the channel and reduce the risk to property behind them (1). Obstructions such as bridges, culverts or fallen trees (1), because they can trap debris and make water back up and overflow (1). Vegetation on the banks and flood plain (1), because it intercepts rain and slows water down, reducing flood peaks (1). Evidence of past floods, e.g. debris lines, flood marks or flood boards on houses (1), because it shows how high floods have reached before (1). Accept any other appropriate response.

  2. 1 mark

    Explanation of how the first factor influences flood risk

  3. 1 mark

    Second, different factor

    The two factors must be different. Do not credit quantitative channel measurements such as width, depth or velocity.

  4. 1 mark

    Explanation of how the second factor influences flood risk

Ready to try the rest? Every answer you write is marked against the mark scheme, so you can see exactly where the marks are.

Study Helper Hints first, answers after you try

Stuck on this one? Ask for a hint and I’ll point you in the right direction, without giving the answer away. Once you’ve checked your answer, I’ll show you how the marks are awarded.