
Level:
Correct: 0
Incorrect: 0
Marks: 0/0
Exam Practice
Course:
Topics:
Edexcel GCSE Geography B (Paper 2) Smart practice A mixed round aimed at your weak spots
Unit 4
Topic 4: The UK's evolving physical landscape
Unit 5
Topic 5: The UK's evolving human landscape
Unit 6
Topic 6: Geographical investigations
Avg
score:
–
Topics
done:
0/28

How a river's channel and valley change downstream

Practise 27 exam-style questions on How a river's channel and valley change downstream for Edexcel GCSE Geography B (Paper 2). Write your answer as you would in the exam and get it marked in seconds against the mark scheme, point by point, with the Study Helper on hand if you get stuck.

  • 27 questions
  • 1–8 marks each
  • Instant marking
  • No sign-up needed
20 questions, marked as you go

Sample questions with model answers

Here are 4 of the questions in this topic, each with a model answer, an explanation of why it earns the marks and the mark scheme an examiner would use.

Question 1

1 mark

Figure 1 is part of an imaginary 1:25 000 Ordnance Survey (OS) map showing the valley of a stream called Hessel Gill (written for this course).

Using the contour lines, state the height of the land at point A.
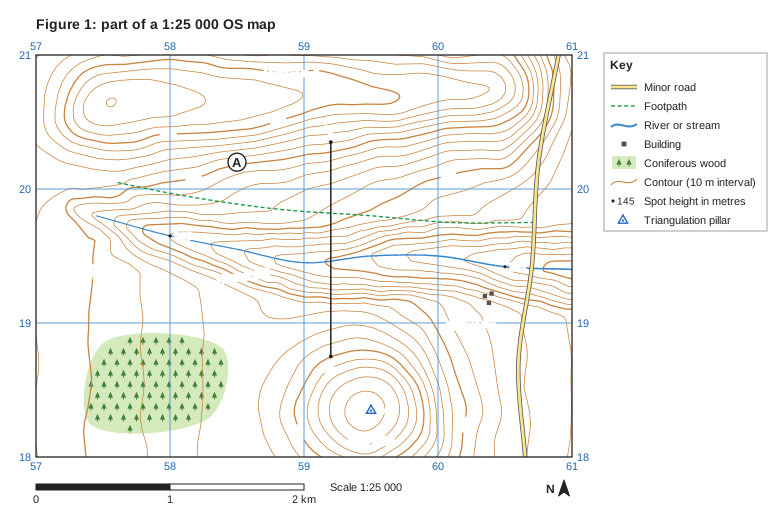
Figure 1: part of a 1:25 000 OS map. Ordnance Survey map extract at a scale of 1:25 000. Blue grid lines divide it into 4 by 3 squares, each 1 km across; the eastings 57, 58, 59, 60, 61 are printed along the top and bottom (increasing to the east) and the northings 18, 19, 20, 21 up both sides (increasing to the north). Brown contour lines show the height of the land every 10 m, with every 50 m line drawn thicker; heights printed on contour lines: 350 m, 400 m, 450 m. Spot heights (a dot with the height in metres): 340 in the west of the map; 261 in the east of the map. Triangulation pillars (blue triangle) with heights: 445 m in the south of the map. Water (blue): a stream runs between the west of the map and the east edge. Roads and paths: a minor road runs between the south edge and the north edge; a footpath (green dashed lines). Land use: 3 separate buildings (small black squares); coniferous woodland (green with tree symbols) in the south-west of the map. Names printed: "Hessel Gill" in the centre of the map; "Hessel Fell" in the north of the map; "Raw Pike" in the south of the map; "Gillfoot Fm" in the south-east of the map. Letters in circles mark places: A in the north of the map. A straight line X–Y is drawn from X in the south of the map to Y in the north of the map. A key beside the map explains: minor road, footpath, river or stream, building, coniferous wood, contour (10 m interval), spot height in metres, triangulation pillar. Below the map: a scale bar marked 0, 1 and 2 km (1 km is the width of one grid square) and a north arrow pointing to the top of the map.

Model answer

About 405 m (A is between the 400 m and 410 m contours).

Explanation

Find the nearest labelled contour (400 m) and count the contour lines (every 10 m) to point A, which lies just above the 400 m line. Common errors are to use the thicker 450 m contour on the ridge or the spot height beside the stream instead of the contours at A.

Mark scheme
  1. 1 mark

    404 m (accept any height from 400 m to 410 m)

    Point A lies between the 400 m and 410 m contours (404 m). Accept any value from 400 m to 410 m, with or without units; also accept 'between 400 m and 410 m'. Do not credit a height outside this range, for example 450 m (the thicker contour higher up the ridge) or 340 m (the spot height beside the stream).
Question 2

2 marks

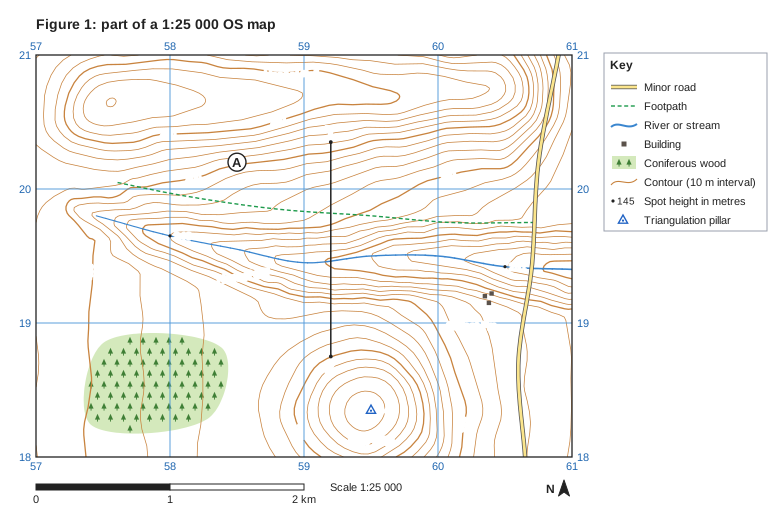
Figure 1 is part of an imaginary 1:25 000 Ordnance Survey (OS) map showing the valley of a stream called Hessel Gill (written for this course).

Hessel Gill flows past the spot height at grid reference 580196 and the spot height at grid reference 605194.

Calculate the average gradient of Hessel Gill between these two spot heights. Use the straight-line distance between them.

Show your working.

Figure 1: part of a 1:25 000 OS map. Ordnance Survey map extract at a scale of 1:25 000. Blue grid lines divide it into 4 by 3 squares, each 1 km across; the eastings 57, 58, 59, 60, 61 are printed along the top and bottom (increasing to the east) and the northings 18, 19, 20, 21 up both sides (increasing to the north). Brown contour lines show the height of the land every 10 m, with every 50 m line drawn thicker; heights printed on contour lines: 350 m, 400 m, 450 m. Spot heights (a dot with the height in metres): 340 in the west of the map; 261 in the east of the map. Triangulation pillars (blue triangle) with heights: 445 m in the south of the map. Water (blue): a stream runs between the west of the map and the east edge. Roads and paths: a minor road runs between the south edge and the north edge; a footpath (green dashed lines). Land use: 3 separate buildings (small black squares); coniferous woodland (green with tree symbols) in the south-west of the map. Names printed: "Hessel Gill" in the centre of the map; "Hessel Fell" in the north of the map; "Raw Pike" in the south of the map; "Gillfoot Fm" in the south-east of the map. Letters in circles mark places: A in the north of the map. A straight line X–Y is drawn from X in the south of the map to Y in the north of the map. A key beside the map explains: minor road, footpath, river or stream, building, coniferous wood, contour (10 m interval), spot height in metres, triangulation pillar. Below the map: a scale bar marked 0, 1 and 2 km (1 km is the width of one grid square) and a north arrow pointing to the top of the map.

Model answer

Fall in height = 340 - 261 = 79 m
Distance = 2.5 km = 2,500 m
Gradient = 79 ÷ 2,500 = 1 in 32 (about 32 m per km)

Explanation

Gradient is the vertical drop divided by the horizontal distance, with both in metres, and is usually written as 1 in x (2,500 ÷ 79 = 32). The distance between the eastings 58.0 and 60.5 is 2.5 km. A common error is to mix metres and kilometres, which gives a nonsense ratio.

Mark scheme
  1. 1 mark

    Method: difference in height ÷ horizontal distance in the same units, e.g. (340 - 261) = 79 m ÷ 2500 m

    Correct answer with no working scores full marks (2 marks). The spot heights are 340 m (at 580196) and 261 m (at 605194), a fall of 79 m. The straight-line distance is 2.5 km (about 2,510 m). Accept a distance from 2.4 km to 2.6 km. Award this mark for a correct method with a wrong answer, e.g. a height difference read wrongly but divided by a correct distance in the same units.

  2. 1 mark

    Answer: 1 in 32 (accept 1 in 30 to 1 in 33)

    Accept equivalent forms: 1:32, about 32 m per km (accept 30 to 33 m per km), 0.032 (accept 0.030 to 0.033, but not 0.03, which is rounded to one significant figure) or 3.2% (accept 3.0% to 3.3%). Do not credit answers using heights other than the two spot heights (e.g. contour values) for this mark, or a ratio worked out with mixed units (e.g. 1 in 0.03).

Question 3

3 marks

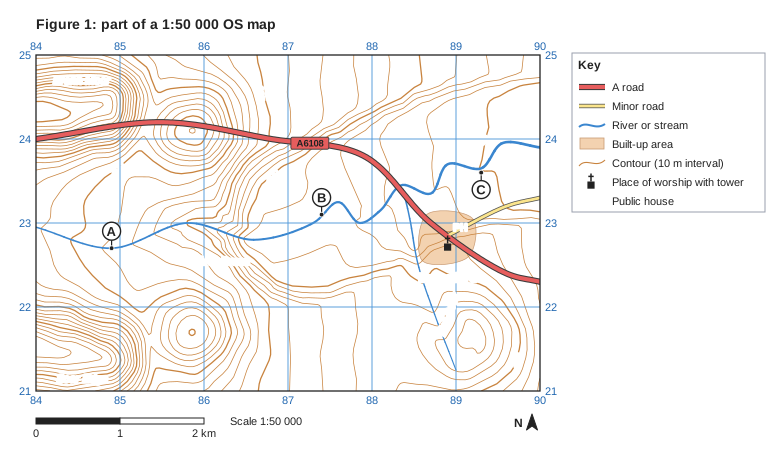
Figure 1 is an extract from an imaginary 1:50 000 Ordnance Survey (OS) map of the River Brenn and its tributary, Kell Beck (written for this course). Points A, B and C are on the River Brenn.

Compare the gradient of the River Brenn between A and B with its gradient between B and C.

Use data from Figure 1 in your answer.

Figure 1: part of a 1:50 000 OS map. Ordnance Survey map extract at a scale of 1:50 000. Blue grid lines divide it into 6 by 4 squares, each 1 km across; the eastings 84, 85, 86, 87, 88, 89, 90 are printed along the top and bottom (increasing to the east) and the northings 21, 22, 23, 24, 25 up both sides (increasing to the north). Brown contour lines show the height of the land every 10 m, with every 50 m line drawn thicker; heights printed on contour lines: 50 m, 100 m, 150 m, 200 m. Water (blue): a river runs between the west edge and the east edge; a stream runs between the south-east of the map and the east of the map. Roads and paths: the A6108 (A road) runs between the west edge and the east edge; a minor road runs between the east of the map and the east edge. Land use: a built-up area (shaded orange) in the east of the map. Symbols: place of worship with tower in the east of the map; "PH" (public house) in the east of the map. Names printed: "Brennford" in the east of the map; "Brenn Moor" in the north-west of the map; "Scar Edge" in the south-west of the map; "Kell Beck" in the south-east of the map; "River Brenn" in the centre of the map. Letters in circles mark places: A in the west of the map (a dot marks the exact place); B in the centre of the map (a dot marks the exact place); C in the east of the map (a dot marks the exact place). A key beside the map explains: A road, minor road, river or stream, built-up area, contour (10 m interval), place of worship with tower, PH = public house. Below the map: a scale bar marked 0, 1 and 2 km (1 km is the width of one grid square) and a north arrow pointing to the top of the map.

Model answer

The River Brenn is much steeper between A and B than between B and C. Between A and B it falls about 105 m, from about 187 m to about 82 m, in about 2.5 km, a gradient of about 1 in 24. Between B and C it falls only about 32 m, to about 50 m, in about 2.0 km, which is about 1 in 61, so the upper stretch is about two and a half times steeper. The river also crosses about ten contours between A and B but only about three between B and C.

Explanation

Each mark needs a comparison of the two stretches, not two separate descriptions. Full marks need map data such as heights from the contours, distances measured with the scale or worked-out gradients. Explaining why the gradient changes is not asked for and earns no credit.

Mark scheme
  1. 1 mark

    First comparative point, e.g. the river is much steeper between A and B than between B and C

    Max 2 if no data from Figure 1 is used. Award 1 mark for each comparative point, up to 3 marks. Data may be heights, distances, gradients or contour counts read from the map. Points (from the description): the river is steeper between A and B than between B and C (1); between A and B it falls about 105 m (from about 187 m at A to about 82 m at B) whereas between B and C it falls only about 32 m (to about 50 m at C) (1); the straight-line distances are similar (about 2.5 km and 2.0 km), so the river falls over three times as far in a similar distance between A and B (1); the gradient between A and B is about 1 in 24 (about 42 m per km) compared with about 1 in 61 (about 16 m per km) between B and C, so A to B is about two and a half times steeper (1); the river crosses about ten contours between A and B but only about three between B and C (1). Accept heights within 5 m of those given, distances within 0.1 km and gradients that follow from accepted readings (about 1 in 20 to 1 in 28 for A to B; about 1 in 45 to 1 in 96 for B to C).

  2. 1 mark

    Second comparative point

    Do not credit explanation (e.g. 'because the river is nearer base level'). Do not credit descriptions of one stretch only, or separate statements with no comparison (e.g. 'A to B is 1 in 24. B to C is 1 in 61.'); a comparative word such as whereas, but, steeper or gentler is needed.

  3. 1 mark

    Third comparative point

    Accept any other appropriate response.

Question 4

4 marks

Explain two limitations of using the contour lines on an Ordnance Survey (OS) map to work out the cross-section (cross profile) of a river valley.

Model answer

1. Contours are drawn only every 10 m (or 5 m), so any feature smaller than one contour interval, such as the river banks or a levee, does not appear, and heights between contours have to be estimated.
2. The river channel is too small to be shown by contours, so the cross-section shows only the valley and not the width, depth or shape of the channel itself, which must be measured in the field.

Explanation

Each limitation scores 1 mark and its explanation another. Strong answers focus on the contour interval, the missing channel detail, flat flood plains with no contours, out-of-date maps or vertical exaggeration. 'It is inaccurate' earns nothing unless the answer explains why.

Mark scheme
  1. 1 mark

    First limitation identified, e.g. contours are drawn only every 5 m or 10 m / the river channel is too small to show / the map may be out of date / flat land has few contours

    Examples: Contours are drawn only every 5 m or 10 m (1) so small features such as river banks, levees or terraces less than one interval high are missed, and heights between contours must be estimated (1). The river channel is too narrow to show its shape (1) so the cross-section cannot show the channel's width, depth or bed below the water (1). A wide flood plain may have no contours crossing it (1) so its exact height and shape are uncertain (1). The map may be out of date (1) because meanders migrate and people build embankments or dig quarries, changing the valley (1). Cross-sections are usually drawn with an exaggerated vertical scale (1) which makes the valley sides look steeper than they really are (1). Accept any other appropriate response.

  2. 1 mark

    Explains the first limitation

    The explanation must show why the limitation reduces the accuracy or usefulness of the cross-section.

  3. 1 mark

    Second, different limitation identified

    The two limitations must be different.

  4. 1 mark

    Explains the second limitation

    Do not credit 'it is not accurate' without saying why. Accept any other appropriate response.

Ready to try the rest? Every answer you write is marked against the mark scheme, so you can see exactly where the marks are.

Study Helper Hints first, answers after you try

Stuck on this one? Ask for a hint and I’ll point you in the right direction, without giving the answer away. Once you’ve checked your answer, I’ll show you how the marks are awarded.