
Level:
Correct: 0
Incorrect: 0
Marks: 0/0
Exam Practice
Course:
Topics:
Edexcel GCSE Geography B (Paper 2) Smart practice A mixed round aimed at your weak spots
Unit 4
Topic 4: The UK's evolving physical landscape
Unit 5
Topic 5: The UK's evolving human landscape
Unit 6
Topic 6: Geographical investigations
Avg
score:
–
Topics
done:
0/28

Rural fieldwork: data, conclusions and evaluation

Practise 26 exam-style questions on Rural fieldwork: data, conclusions and evaluation for Edexcel GCSE Geography B (Paper 2). Write your answer as you would in the exam and get it marked in seconds against the mark scheme, point by point, with the Study Helper on hand if you get stuck.

  • 26 questions
  • 1–8 marks each
  • Instant marking
  • No sign-up needed
20 questions, marked as you go

Sample questions with model answers

Here are 4 of the questions in this topic, each with a model answer, an explanation of why it earns the marks and the mark scheme an examiner would use.

Question 1

1 mark

Figure 1 shows the total environmental quality scores recorded by a group of students at 15 sites in each of two imaginary villages, Ashwell and Kirkfield (data written for this course). Each total could range from -24 to +24.

Calculate the percentage of the sites in Kirkfield that had a total score below zero.

Give your answer to the nearest whole number.
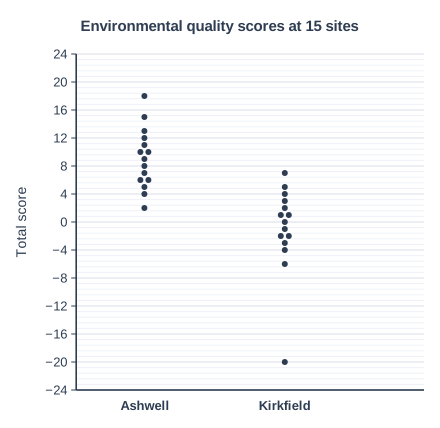
Environmental quality scores at 15 sites. Dispersion graph: 2 columns of dots on a vertical scale "Total score" from −24 to 24, numbered every 4; each dot is one value, and equal values are drawn side by side. "Ashwell" has 15 dots, from lowest to highest: 2, 4, 5, 6 (2 dots), 7, 8, 9, 10 (2 dots), 11, 12, 13, 15, 18. "Kirkfield" has 15 dots, from lowest to highest: −20, −6, −4, −3, −2 (2 dots), −1, 0, 1 (2 dots), 2, 3, 4, 5, 7.

Model answer

7 sites scored below zero.
7 ÷ 15 × 100 = 46.7%, so 47%

Explanation

Count the dots below the zero line, taking care not to include the site that scored exactly 0, then divide by the 15 sites and multiply by 100. Almost half the Kirkfield sites had negative scores, while none of the Ashwell sites did. A common error is to count the zero score as negative.

Mark scheme
  1. 1 mark

    47%

    7 of the 15 Kirkfield sites scored below zero (-20, -6, -4, -3, -2, -2, -1): 7 ÷ 15 × 100 = 46.7%, which is 47% to the nearest whole number. Accept 47 or 47%. Must be given to the nearest whole number: do not credit 46.7 or 46.67 for this mark. Do not accept 53% (8 ÷ 15, which wrongly counts the score of 0 as below zero) or 7 (the number of sites, not the percentage). Correct answer with no working scores full marks.
Question 2

2 marks

A group of students investigated deprivation in five villages in one rural district.

Explain one reason why their conclusions may not apply to other rural areas in the UK.

Model answer

Rural areas in the UK are very different from each other. Villages within commuting distance of a large city are often wealthy, while remote upland villages may have many older residents and few services, so deprivation in another rural area may vary for different reasons from those the students found.

Explanation

One mark is for a reason and one for explaining why the findings might not apply elsewhere. Good answers name different types of rural area, such as commuter villages, remote uplands and coastal tourist areas. A common error is to say 'it is only one area' without explaining why other areas might be different.

Mark scheme
  1. 1 mark

    Identifies a valid reason, e.g. rural areas differ (remote uplands, coastal tourist areas, commuter villages near cities) / five villages is a small sample / local factors such as a bus route, a large employer or many second homes may be unusual

    Examples: Rural areas in the UK are very different (1); villages near a large city are often wealthy commuter settlements, while remote upland or coastal villages may have more elderly people and second homes, so deprivation may vary for different reasons (1). Five villages is a small sample (1), so the pattern found might be caused by something unusual in this district, such as one village having a good bus service (1). The data were collected at one time (1), so changes such as the closure of a shop or a new housing estate elsewhere would not be reflected (1). Accept any other appropriate response.

  2. 1 mark

    Develops the reason, explaining why the findings might not be typical of other rural areas

    Do not credit 'every area is different' in isolation without saying how or why.

Question 3

4 marks

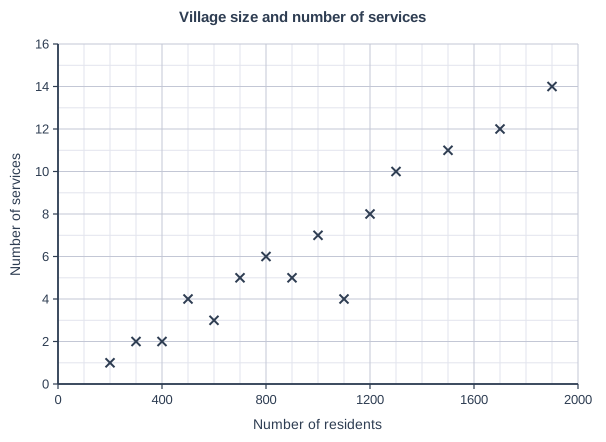
Figure 1 shows the number of residents and the number of services in 15 imaginary villages in one rural district (data written for this course).

Suggest two reasons for the relationship between the number of residents and the number of services shown in Figure 1.

Village size and number of services. Scatter graph on a grid of small squares. The horizontal axis is "Number of residents", from 0 to 2000, numbered every 400, with 4 small squares between numbered values (each small square is 100). The vertical axis is "Number of services", from 0 to 16, numbered every 2, with 2 small squares between numbered values (each small square is 1). 15 points are plotted as crosses: (200, 1), (300, 2), (400, 2), (500, 4), (600, 3), (700, 5), (800, 6), (900, 5), (1000, 7), (1100, 4), (1200, 8), (1300, 10), (1500, 11), (1700, 12) and (1900, 14).

Model answer

First, larger villages have more residents to use and pay for services, so more services reach their threshold population and can stay open; the village with 1 900 residents has 14 services, while one with 200 has only 1. Second, schools and GP surgeries are placed where there are enough pupils or patients, so they are found in the larger villages and small villages miss out.

Explanation

Each reason needs a point and a development explaining how village size affects the number of services. Good answers use the idea of threshold population and the centralisation of services in larger places. A common error is to describe the relationship again instead of explaining it.

Mark scheme
  1. 1 mark

    First reason, e.g. larger villages have more customers, so they reach the threshold population needed for more services

    Examples: Larger villages have more residents spending money (1), so more services, such as a shop, a pub and a post office, reach the threshold population they need to stay open (1). Schools and GP surgeries are usually placed where there are enough pupils or patients (1), so they are found in the larger villages (1). Larger villages are often on main roads or bus routes (1), so they attract customers from smaller places nearby as well as their own residents (1). In small villages most people drive to shops and services in towns (1), so the few local services lose trade and close (1). Accept any other appropriate response, including data from Figure 1 within a reason; readings within half a small square (plus or minus 50 residents and 0.5 services) of the plotted values are acceptable.

  2. 1 mark

    Develops the first reason

  3. 1 mark

    Second, different reason

    The two reasons must be different. Do not credit a description of the relationship (e.g. 'bigger villages have more services') as a reason.

  4. 1 mark

    Develops the second reason

Question 4

4 marks

A group of students counted the services, such as shops, pubs, post offices and GP surgeries, in each village in their study area and used the totals as a measure of deprivation.

Explain two limitations of using the number of services to measure deprivation in a village.

Model answer

First, a count treats every service as equal, so a village with two pubs scores the same as one with a GP surgery and a shop, even though the second meets far more everyday needs. Second, deprivation also includes income, health and housing, so a village with many services can still contain households in poverty, which the count would not show.

Explanation

Each limitation needs a point and a development explaining how it could give a misleading picture of deprivation. Good answers think about the type of service, how often it is open, access to services elsewhere and the other parts of deprivation. A common error is to give two limitations that make the same point.

Mark scheme
  1. 1 mark

    First limitation, e.g. a count treats all services as equal / it ignores opening hours or quality / it ignores services in a nearby town and how easily they can be reached / it does not measure income, health or housing / it ignores village size

    Examples: A count treats every service as equal (1), so a village with two pubs scores the same as one with a GP surgery and a shop, although the second meets far more everyday needs (1). It ignores opening hours (1); a post office open two mornings a week counts the same as one open every day (1). It does not show how easily residents can reach services in a nearby town (1), so a village with few services but a frequent bus may be less deprived than the count suggests (1). Deprivation also includes income, health and housing (1), so a village with many services can still have households in poverty (1). Accept any other appropriate response.

  2. 1 mark

    Develops the first limitation

  3. 1 mark

    Second, different limitation

    The two limitations must be different.

  4. 1 mark

    Develops the second limitation

Ready to try the rest? Every answer you write is marked against the mark scheme, so you can see exactly where the marks are.

Study Helper Hints first, answers after you try

Stuck on this one? Ask for a hint and I’ll point you in the right direction, without giving the answer away. Once you’ve checked your answer, I’ll show you how the marks are awarded.