A major UK city: migration, character and inequality
Practise 25 exam-style questions on A major UK city: migration, character and inequality for Edexcel GCSE Geography B (Paper 2). Write your answer as you would in the exam and get it marked in seconds against the mark scheme, point by point, with the Study Helper on hand if you get stuck.
25 questions
1–12 marks each
Instant marking
No sign-up needed
20 questions, marked as you go
Sample questions with model answers
Here are 4 of the questions in this topic, each with a model answer, an explanation of why it earns the marks and the mark scheme an examiner would use.
Question 1
1 mark
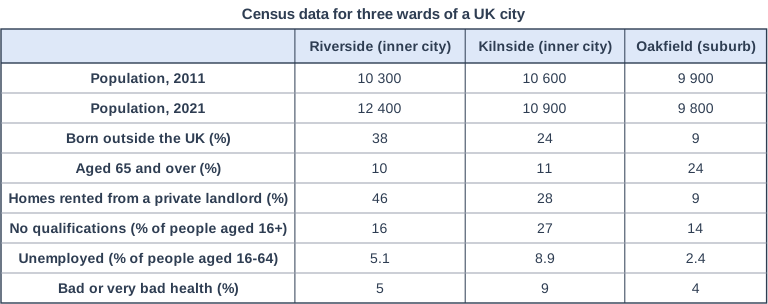
Study Figure 1, which shows census data for three wards of a UK city. The data were written for this course.
Calculate the number of people living in Riverside in 2021 who were born outside the UK.
Model answer
12,400 × 38 ÷ 100 = 4,712 people
Explanation
To find a percentage of a total, multiply the total (12,400 people in 2021) by the percentage and divide by 100. A common error is to use the 2011 population or to give the percentage instead of a number of people.
Mark scheme
1 mark
4,712 (12,400 × 38 ÷ 100)
Accept 4,712 or 4712; also accept 4,710 or 4,700 if correctly rounded from 4,712. Correct answer with no working scores full marks. Do not credit 38, 38% or 4,712%, or answers based on the 2011 population (3,914).
Question 2
2 marks
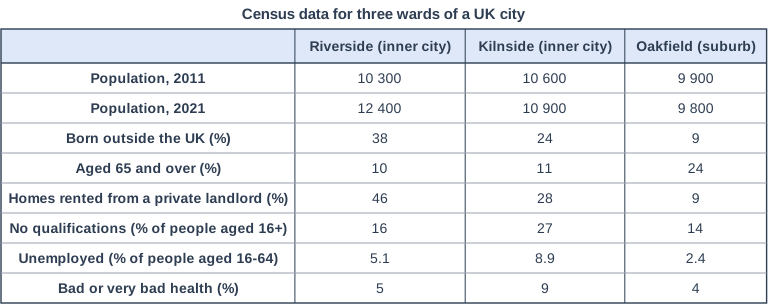
Study Figure 1, which shows census data for three wards of a UK city. The data were written for this course.
Suggest one reason why the unemployment rate in Kilnside is higher than in Riverside.
Model answer
More people in Kilnside have no qualifications (27% compared with 16% in Riverside), so they find it harder to get jobs in the city's growing service industries, which often need qualifications and skills.
Explanation
A suggested reason should be plausible and, ideally, supported by evidence from the table, such as the higher proportion with no qualifications or in bad health. Saying that Kilnside has more unemployed people only repeats the data.
Mark scheme
1 mark
Identifies a plausible reason, e.g. more people in Kilnside have no qualifications / Kilnside may be an old industrial area where factories have closed / more people in Kilnside have poor health / Riverside attracts people who move there for jobs or study
Examples: More people in Kilnside have no qualifications (27% compared with 16%) (1) so they find it harder to get jobs in the city's growing service sector, which often needs skills (1). Kilnside may be an old industrial area where factories closed (1) so many workers lost jobs and their skills are no longer in demand (1). More people in Kilnside are in bad health (9% compared with 5%) (1) which can stop people from working (1). Riverside's population grew quickly, perhaps because people moved there for jobs or study (1), so more of its residents already have work (1). Accept any other appropriate response.
1 mark
Develops the reason, e.g. with data from Figure 1 or by explaining how it leads to unemployment
Do not credit a restatement that Kilnside has more unemployment (8.9% compared with 5.1%).
Question 3
3 marks
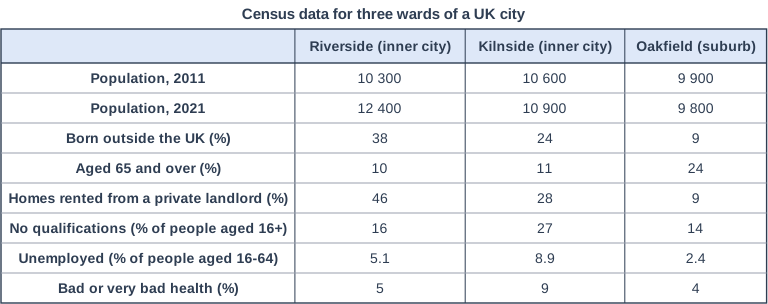
Study Figure 1, which shows census data for three wards of a UK city. The data were written for this course.
Compare the characteristics of the population of Riverside with those of Oakfield.
Use data from Figure 1 in your answer.
Model answer
Riverside's population grew from 10,300 to 12,400 between 2011 and 2021, whereas Oakfield's fell slightly from 9,900 to 9,800. Riverside has about four times the proportion of people born outside the UK (38% compared with 9%). Riverside's population is also younger, with only 10% aged 65 and over compared with 24% in Oakfield.
Explanation
Each mark needs one comparative statement about both wards, using the data. Writing out the values for each ward separately, or explaining why they differ, does not earn marks. Without data the maximum is 2.
Mark scheme
1 mark
A first valid comparative statement, e.g. Riverside has a much larger share of people born outside the UK than Oakfield (38% compared with 9%)
Max 2 if no data from Figure 1 is used. Award one mark for each comparative point, up to 3. Creditable comparisons: Riverside's population grew (10,300 to 12,400) while Oakfield's fell slightly (9,900 to 9,800) (1). Riverside has about four times the share of people born outside the UK (38% v 9%) (1). Riverside has a much smaller share aged 65 and over (10% v 24%) (1). Far more homes in Riverside are privately rented (46% v 9%) (1). Unemployment is more than twice as high in Riverside (5.1% v 2.4%) (1). Riverside has slightly more people with no qualifications (16% v 14%) and slightly more in bad health (5% v 4%) (1). Credit data manipulation, e.g. 'Riverside has 2,600 more people'. Accept any other appropriate comparison.
1 mark
A second, different comparative statement
Do not credit data lifts directly from the figure: each mark needs a comparison of the two wards, not two separate descriptions.
1 mark
A third, different comparative statement
Do not credit explanation of the differences (e.g. why migrants live in Riverside).
Question 4
4 marks
Explain why parts of a city with high unemployment and many low-paid jobs often also have lower educational attainment.
Model answer
In some parts of a city many adults are unemployed or work in low-paid jobs, so household incomes are low. Families on low incomes often cannot afford a computer, books or a quiet room for homework, and some teenagers have to take on part-time work or care for relatives. As a result, pupils in these areas tend to get lower exam results than pupils in wealthier areas, which reduces their chances of getting well-paid jobs later, so the inequality continues into the next generation.
Explanation
This question rewards a linked chain: employment affects income, income affects the resources and time children have for study, and this affects results (and future jobs). Each step that develops the chain earns a mark. Lists of unconnected points score less well.
Mark scheme
4 marks
Award 1 mark for a basic link between unemployment or low pay and education and up to three further marks for developing the chain of effects: 1 + (1+1+1), or (1+1) + (1+1) for two separate links
Example chain: Household incomes in these areas are low (1), so families cannot afford computers, books, trips or a quiet space to study (1), and some young people take on caring or part-time work, leaving less time for schoolwork (1), so pupils tend to get lower exam results, which in turn limits their chances of well-paid jobs, continuing the cycle (1). Do not credit a restatement of the question (that these areas have high unemployment and low pay) as the first point. Other valid links: In areas where few adults have skilled jobs, children may have fewer role models in professional careers (1) and lower expectations of going to university (1). Wealthier areas with high employment can afford tutors and support school fundraising (1), widening the gap in results (1). Accept any other appropriate response. Do not credit description of unequal results without a link to employment.
Ready to try the rest? Every answer you write is marked against the mark scheme, so you can see exactly where the marks are.
Ctrl + Enter to check
Study HelperHints first, answers after you try
Stuck on this one? Ask for a hint and I’ll point you in the right direction, without giving the answer away. Once you’ve checked your answer, I’ll show you how the marks are awarded.