
Level:
Correct: 0
Incorrect: 0
Marks: 0/0
Exam Practice
Course:
Topics:
Edexcel GCSE Geography B (Paper 2) Smart practice A mixed round aimed at your weak spots
Unit 4
Topic 4: The UK's evolving physical landscape
Unit 5
Topic 5: The UK's evolving human landscape
Unit 6
Topic 6: Geographical investigations
Avg
score:
–
Topics
done:
0/28

Migration and the UK's changing population

Practise 26 exam-style questions on Migration and the UK's changing population for Edexcel GCSE Geography B (Paper 2). Write your answer as you would in the exam and get it marked in seconds against the mark scheme, point by point, with the Study Helper on hand if you get stuck.

  • 26 questions
  • 1–12 marks each
  • Instant marking
  • No sign-up needed
20 questions, marked as you go

Sample questions with model answers

Here are 4 of the questions in this topic, each with a model answer, an explanation of why it earns the marks and the mark scheme an examiner would use.

Question 1

1 mark

Study Figure 1, which shows long-term international migration to and from the UK by nationality group in the year ending December 2025 (source: ONS, Long-term international migration, provisional, May 2026). EU+ means the EU countries plus Iceland, Liechtenstein, Norway and Switzerland.

Calculate the net migration of EU+ nationals, shown as X in Figure 1.
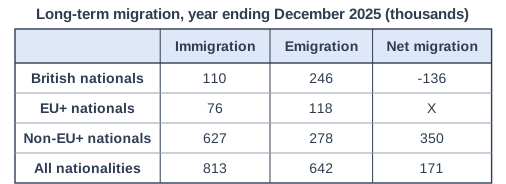
Long-term migration, year ending December 2025 (thousands). Table with columns (row headings), "Immigration", "Emigration", "Net migration". British nationals; Immigration: 110; Emigration: 246; Net migration: -136 | EU+ nationals; Immigration: 76; Emigration: 118; Net migration: X | Non-EU+ nationals; Immigration: 627; Emigration: 278; Net migration: 350 | All nationalities; Immigration: 813; Emigration: 642; Net migration: 171.

Model answer

76 - 118 = -42 thousand (a net loss of 42 000 EU+ nationals)

Explanation

Net migration is immigration minus emigration: 76 - 118 = -42 thousand, so 42 000 more EU+ nationals left the UK than arrived. Forgetting the minus sign (or not saying it is a loss) is the most common error.

Mark scheme
  1. 1 mark

    -42 (thousand), i.e. 76 - 118

    Accept -42, -42 thousand, -42 000, or a net loss / net outflow of 42 thousand (42 000) people. Correct answer with no working scores full marks. Do not credit 42 or +42 with no indication that it is a loss, and do not credit 194 (the two values added).
Question 2

2 marks

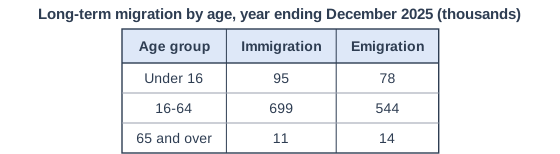
Study Figure 1, which shows the ages of people migrating to and from the UK long-term in the year ending December 2025 (source: ONS, Long-term international migration, provisional, May 2026; age data are not available for Irish nationals, so they are not included).

Using Figure 1, explain one way in which international migration like this changes the age structure of the UK's population.

Long-term migration by age, year ending December 2025 (thousands). Table with columns "Age group", "Immigration", "Emigration". Age group: Under 16; Immigration: 95; Emigration: 78 | Age group: 16-64; Immigration: 699; Emigration: 544 | Age group: 65 and over; Immigration: 11; Emigration: 14.

Model answer

Most people arriving are of working age: 699 thousand immigrants were aged 16-64, compared with only 11 thousand aged 65 and over. This adds young adults to the population, which slows down the ageing of the UK's population.

Explanation

One mark is for the way (adding working-age adults, few older migrants or more births) and one for explaining its effect on the age structure. Answers about the total size of the population do not answer a question about age structure.

Mark scheme
  1. 1 mark

    Identifies a valid way, e.g. it adds people of working age (16-64) / it increases the proportion of young adults / it slows the ageing of the population / it raises the number of births

    Examples: Most immigrants are aged 16-64 (699 thousand of the arrivals) (1) so migration adds more working-age adults than it removes, slowing the rise in the proportion of older people (1). Very few migrants are aged 65 and over (11 thousand arriving, 14 thousand leaving) (1) so migration hardly adds to the elderly population while increasing the young adult groups (1). Many migrants are young adults who go on to have children in the UK (1) which increases the number of births and widens the base of the population pyramid (1). Accept any other appropriate response.

  2. 1 mark

    Develops the way, e.g. explains the effect on the age structure or on the population pyramid

    The development must explain the same way. Use of data from Figure 1 can support either mark but is not required for 2 marks.

Question 3

4 marks

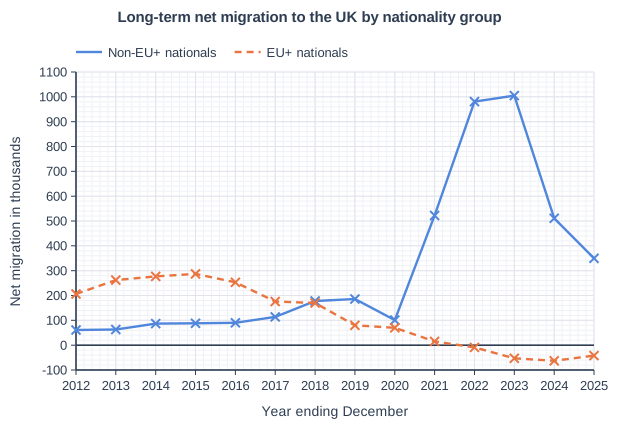
Study Figure 1, which shows long-term net migration to the UK of EU+ nationals and non-EU+ nationals for each year ending in December, 2012 to 2025 (EU+ means the EU countries plus Iceland, Liechtenstein, Norway and Switzerland; source: ONS, Long-term international migration, provisional, May 2026).

Using Figure 1, suggest two reasons for the changes in net migration of EU+ nationals between 2012 and 2025.

Long-term net migration to the UK by nationality group. Line graph of net migration in thousands (y-axis, -100 to 1100) against Year ending December (x-axis, 2012 to 2025). "Non-EU+ nationals" joins the points (2012, 61), (2013, 63), (2014, 87), (2015, 88), (2016, 90), (2017, 114), (2018, 178), (2019, 186), (2020, 101), (2021, 522), (2022, 981), (2023, 1005), (2024, 511), (2025, 350). "EU+ nationals" (dashed) joins the points (2012, 206), (2013, 262), (2014, 277), (2015, 287), (2016, 253), (2017, 176), (2018, 170), (2019, 80), (2020, 70), (2021, 15), (2022, -9), (2023, -53), (2024, -63), (2025, -42).

Model answer

1. Until the end of 2020 EU citizens had the right to live and work in the UK. Many came for jobs because wages were higher than in their home countries, so EU+ net migration was high, peaking at 287 thousand in 2015.
2. After the UK voted to leave the EU in 2016, and especially when free movement ended in 2020, EU citizens needed a visa under the points-based system to work in the UK. Fewer came and many returned home, so EU+ net migration fell to 80 thousand in 2019 and became negative from 2022 (-63 thousand in 2024).

Explanation

Each reason earns 1 mark and its development 1 more; the answer must use evidence from Figure 1 in at least one reason, or it is limited to 3 marks. The strongest answers link specific changes on the graph (the 2015 peak, the fall after 2016, negative values from 2022) to specific policies.

Mark scheme
  1. 1 mark

    First reason, e.g. free movement within the EU allowed high EU+ migration (about 206-287 thousand a year in 2012-2016)

    Max 3 if no data or evidence from Figure 1 is used. Examples: Until 2020 EU citizens could live and work in the UK freely (1), so net migration of EU+ nationals was high, peaking at 287 thousand in 2015 (1). Limits on Romanian and Bulgarian workers ended in 2014 (1) which helped EU+ net migration rise in 2014-2015 (1). The vote to leave the EU in 2016 created uncertainty (1) so fewer EU citizens came and more left, and net migration fell to 80 thousand by 2019 (1). Free movement ended in December 2020 and EU citizens then needed visas under the points-based system (1) so EU+ net migration became negative from 2022 (1). The pound fell in value after 2016 (1) so wages earned in the UK were worth less when sent home (1). COVID-19 travel restrictions in 2020 (1) reduced arrivals (1). Accept any other appropriate response. The two reasons must be different. Readings within half a gridline (plus or minus 10 thousand) of the values given are acceptable.

  2. 1 mark

    Development of the first reason

  3. 1 mark

    Second, different reason, e.g. the 2016 vote to leave the EU / the end of free movement in 2020 and the points-based system from 2021

    Data or evidence from Figure 1 (a value, a year or the trend) is needed in at least one reason for 4 marks.

  4. 1 mark

    Development of the second reason

Question 4

4 marks

In January 2021 the UK introduced a points-based immigration system for both EU and non-EU migrants.

Explain one advantage and one disadvantage of this system for the UK.

Model answer

Advantage: The government can decide which skills and salary levels are needed for a visa. This means employers can recruit people for jobs where there are shortages, such as nurses and engineers, from anywhere in the world.
Disadvantage: It is much harder to recruit EU workers for lower-paid jobs. Farms, hotels and care homes have found it difficult to fill vacancies, which can mean crops are not picked or services are reduced.

Explanation

Each side earns 1 mark and its development 1 more. Advantages and disadvantages can be economic or social, but each must be explained, not just stated, and the two must be clearly different.

Mark scheme
  1. 1 mark

    An advantage, e.g. the government can choose migrants with the skills the economy needs / it treats EU and non-EU migrants equally / it gives more control over the number of migrants

    Examples (advantage): The government can set the skills and salary levels needed for a visa (1) so migrants can be recruited for jobs where there are shortages, such as doctors, nurses and engineers (1). EU and non-EU migrants are treated the same (1) so skilled workers from countries such as India and Nigeria have the same chance as Europeans (1). The government can change the rules to raise or lower numbers (1), as when rules were tightened in 2024 and 2025 (1). Accept any other appropriate response.

  2. 1 mark

    Development of the advantage

  3. 1 mark

    A disadvantage, e.g. shortages of workers in lower-paid jobs (farming, hospitality, care) / more paperwork and cost for employers / net migration actually rose sharply after 2021 / families may be separated

    Examples (disadvantage): It is harder to recruit EU workers for lower-paid jobs (1) so farms, hotels and care homes have struggled to fill vacancies, for example fruit-picking jobs (1). Employers must pay fees and sponsor workers (1) which adds costs, especially for small businesses (1). Net migration rose to record levels after 2021 (1) so the system did not reduce numbers as many people expected (1). Rules can change quickly (1), so some migrants cannot bring their families, which may discourage them from coming or staying (1). Accept any other appropriate response.

  4. 1 mark

    Development of the disadvantage

Ready to try the rest? Every answer you write is marked against the mark scheme, so you can see exactly where the marks are.

Study Helper Hints first, answers after you try

Stuck on this one? Ask for a hint and I’ll point you in the right direction, without giving the answer away. Once you’ve checked your answer, I’ll show you how the marks are awarded.