Practise 26 exam-style questions on Urban fieldwork: data, conclusions and evaluation for Edexcel GCSE Geography B (Paper 2). Write your answer as you would in the exam and get it marked in seconds against the mark scheme, point by point, with the Study Helper on hand if you get stuck.
26 questions
1–8 marks each
Instant marking
No sign-up needed
20 questions, marked as you go
Sample questions with model answers
Here are 4 of the questions in this topic, each with a model answer, an explanation of why it earns the marks and the mark scheme an examiner would use.
Question 1
1 mark
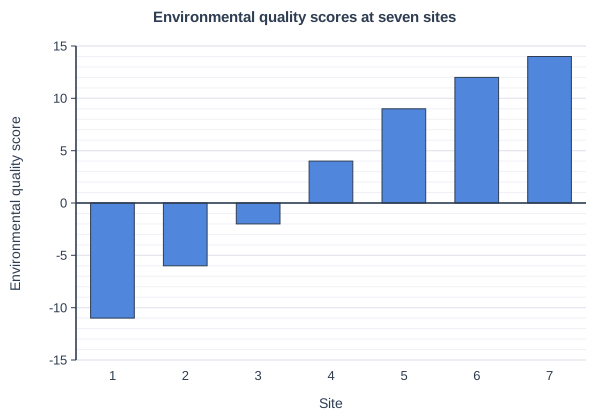
Figure 1 shows the environmental quality scores recorded at seven sites in a town (data written for this course).
Calculate the range of the environmental quality scores.
Model answer
14 - (-11) = 25
Explanation
The range is the highest value minus the lowest value. Because the lowest score is negative, subtracting -11 is the same as adding 11, so the range is 14 + 11 = 25; ignoring the minus sign gives the wrong answer of 3.
Mark scheme
1 mark
25 (+14 at Site 7 minus -11 at Site 1; accept 24 to 26 from the student's own readings)
Correct answer with no working scores the mark. Accept 25 or +25. Accept readings from -11.5 to -10.5 (Site 1) and from 13.5 to 14.5 (Site 7), half a gridline either side of the plotted values. Award the mark for the range worked correctly from the student's own readings within these ranges: answers from 24 to 26, e.g. 25 from -11 and +14. Do not accept 3 (14 - 11, ignoring the minus sign) or the two values on their own (e.g. '-11 to +14').
Question 2
2 marks
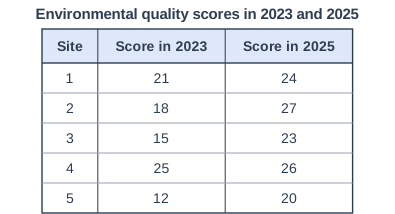
Students surveyed the same five sites in a regeneration area of a town in 2023 and again in 2025, using the same environmental quality survey. Each site was given a score out of 40. Figure 1 shows their results (data written for this course).
Calculate the percentage increase in the score at Site 3 between 2023 and 2025. Give your answer to one decimal place.
Percentage increase = (new value - original value) ÷ original value × 100, so the 2023 score of 15 is the starting value. Dividing by the 2025 score is the most common error.
Mark scheme
1 mark
Method: (23 - 15) ÷ 15 × 100, or 8 ÷ 15 × 100
Correct answer: 53.3(%); accept 53.3 or 53.3%. Correct answer with no working scores full marks (2). Award 1 mark for correct working with a wrong answer or an answer not given to one decimal place (e.g. 53.33 or 53). Do not accept 34.8 (8 ÷ 23 × 100, using the 2025 score as the starting value) or 8 (the increase in points, not a percentage).
1 mark
Answer: 53.3(%)
Must be given to one decimal place: do not credit 53 or 53.33 for this mark.
Question 3
3 marks
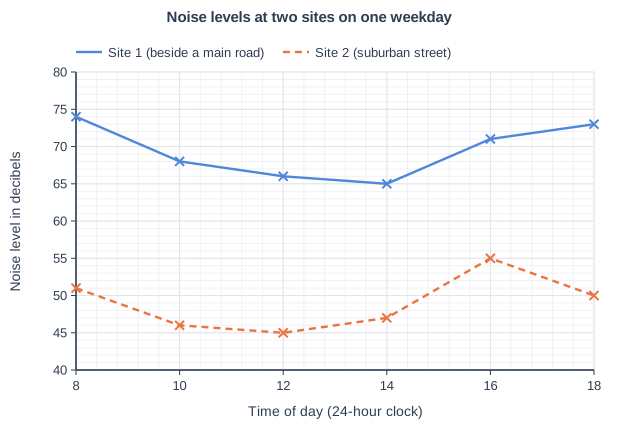
A group of students took noise meter readings every two hours on one weekday at two sites in a town. Site 1 is beside a main road in an inner area and Site 2 is in a suburban street. Figure 1 shows their results (data written for this course).
Compare the noise levels at Site 1 and Site 2.
Model answer
Site 1 is noisier than Site 2 at every time of day, by between 16 and 23 decibels; for example, at 08:00 Site 1 recorded 74 decibels compared with 51 at Site 2. Both sites are quietest around the middle of the day. However, Site 1 is loudest at 08:00, whereas Site 2 is loudest at 16:00 (55 decibels).
Explanation
Each mark is for a comparative statement that refers to both sites, ideally with data. Describing one site at a time, or explaining why the main road is noisier, does not earn marks in a Compare question.
Mark scheme
1 mark
A first comparative point, e.g. Site 1 is noisier than Site 2 at every time of day
Award 1 mark for each comparative statement, up to 3 marks. Examples: Site 1 is noisier than Site 2 at every time of day (1). The difference is between 16 and 23 decibels, e.g. 74 decibels at Site 1 compared with 51 at Site 2 at 08:00 (1). The gap is smallest at 16:00 (71 compared with 55 decibels) (1). Both sites are quietest around the middle of the day (Site 1 lowest at 14:00, 65 decibels; Site 2 lowest at 12:00, 45 decibels) (1). Site 1 is loudest at 08:00 (74 decibels), whereas Site 2 is loudest at 16:00 (55 decibels) (1). The readings vary by a similar amount at both sites (9 decibels at Site 1 and 10 at Site 2) (1). Readings within half a gridline (plus or minus 0.5 decibels) of the values given are acceptable. Do not credit explanation (e.g. why the main road is noisier). Do not credit data lifts that describe one site only (e.g. 'Site 1 is 74 decibels at 08:00').
1 mark
A second, different comparative point
Each mark needs a statement about both sites (e.g. higher, lower, the same, whereas).
1 mark
A third, different comparative point
Data used to support a comparison may be credited (e.g. a difference worked out from the figure). Accept any other appropriate response.
Question 4
4 marks
You have carried out your own fieldwork investigating how and why quality of life varies within urban areas.
Explain how the qualitative data you collected helped you to explain your quantitative results.
Model answer
Our quantitative data showed that environmental quality scores rose from a mean of -6 in the inner area to +9 in the suburb, but the scores alone did not tell us why. Interviews with residents helped to explain this pattern: in the inner area several people said that drivers used their street as a short cut, making it noisy and unsafe for children, which matched the low traffic and noise scores we recorded.
The qualitative data also explained a result that did not fit. Residents' satisfaction ratings in the inner area were higher than we expected from its low environmental quality scores. In interviews, many said they valued being close to family, shops and the bus station, and that neighbours looked out for each other. This showed that quality of life depends on more than the environment, which explained why our two sets of quantitative results did not match.
Explanation
Marks are for showing how specific qualitative evidence, such as residents' comments, explained specific quantitative results, such as low scores or an anomaly. Describing how the interviews were carried out, without linking them to the numerical results, does not answer the question.
Mark scheme
1 mark
Identifies one way in which qualitative data helped to explain a quantitative result, e.g. residents' comments gave reasons for low or high environmental quality scores / interviews explained an anomaly / views showed things the survey did not measure (e.g. community, access to services) / annotated photographs or field sketches showed the features that caused a low score
Answers will vary with the centre's fieldwork; credit any valid qualitative method (e.g. interviews, open questions, annotated photographs, field sketches) and any valid quantitative results (e.g. environmental quality scores, litter counts, noise readings, rating-scale results). Do not penalise the absence of a named fieldwork location. Examples: The environmental quality score at Site 4 was much lower than at nearby sites (1); residents told us a takeaway had opened and that litter built up every evening (1), which explained the anomaly (1). The mean score was lowest in the inner area (1), and in interviews residents said traffic used their street as a short cut (1), which explained the low traffic and noise scores (1). Satisfaction ratings in the most deprived area were higher than we expected from its low scores (1); interviews showed that many residents valued a strong sense of community and being close to family (1), which the environmental survey could not measure (1). Do not credit answers that only describe the qualitative method without linking it to quantitative results. Accept any other appropriate response.
3 marks
Up to three further marks: development of the first way and/or a second way with its development ((1+1) + (1+1) or 1 + (1+1+1))
Each further mark needs a linked development or a second, different way. A second way that is only named earns 1 mark; development marks need a link between specific qualitative evidence and a specific quantitative result.
Ready to try the rest? Every answer you write is marked against the mark scheme, so you can see exactly where the marks are.
Ctrl + Enter to check
Study HelperHints first, answers after you try
Stuck on this one? Ask for a hint and I’ll point you in the right direction, without giving the answer away. Once you’ve checked your answer, I’ll show you how the marks are awarded.