
Level:
Correct: 0
Incorrect: 0
Marks: 0/0
Exam Practice
Course:
Topics:
Edexcel GCSE Geography B (Paper 2) Smart practice A mixed round aimed at your weak spots
Unit 4
Topic 4: The UK's evolving physical landscape
Unit 5
Topic 5: The UK's evolving human landscape
Unit 6
Topic 6: Geographical investigations
Avg
score:
–
Topics
done:
0/28

Coastal flood risk and managing the coast

Practise 28 exam-style questions on Coastal flood risk and managing the coast for Edexcel GCSE Geography B (Paper 2). Write your answer as you would in the exam and get it marked in seconds against the mark scheme, point by point, with the Study Helper on hand if you get stuck.

  • 28 questions
  • 1–8 marks each
  • Instant marking
  • No sign-up needed
20 questions, marked as you go

Sample questions with model answers

Here are 4 of the questions in this topic, each with a model answer, an explanation of why it earns the marks and the mark scheme an examiner would use.

Question 1

1 mark

Figure 1 is part of a 1:25 000 OS map of an imaginary coastline (written for this course).

Give the six-figure grid reference of the point where the stream that flows through Greysands reaches the sea.
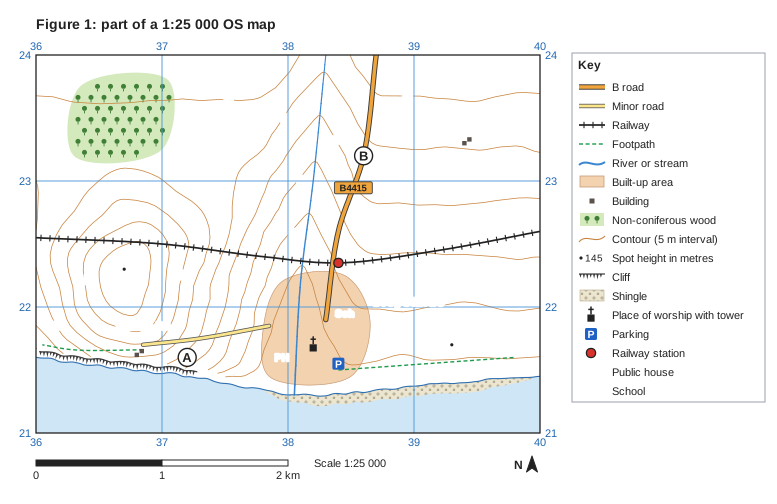
Figure 1: part of a 1:25 000 OS map. Ordnance Survey map extract at a scale of 1:25 000. Blue grid lines divide it into 4 by 3 squares, each 1 km across; the eastings 36, 37, 38, 39, 40 are printed along the top and bottom (increasing to the east) and the northings 21, 22, 23, 24 up both sides (increasing to the north). Brown contour lines show the height of the land every 5 m, with every 50 m line drawn thicker; heights printed on contour lines: 10 m, 15 m, 20 m, 25 m, 30 m, 35 m, 40 m. Spot heights (a dot with the height in metres): 49 in the west of the map; 6 in the south-east of the map. The sea (pale blue) lies to the south, with the coastline drawn as a blue line; cliffs (black comb-like symbol) run along part of the coast (south-west); a shingle beach (south-east) along the shore. Water (blue): a stream runs between the north edge and the south of the map. Roads and paths: the B4415 (B road) runs between the north edge and the south of the map; a minor road runs between the south of the map and the south-west of the map; a railway runs between the west edge and the east edge; 2 footpaths (green dashed lines). Land use: a built-up area (shaded orange) in the south of the map; 4 separate buildings (small black squares); non-coniferous woodland (green with tree symbols) in the north-west of the map. Symbols: railway station in the centre of the map; place of worship with tower in the south of the map; "Sch" (school) in the south of the map; "PH" (public house) in the south of the map; parking in the south of the map. Names printed: "Greysands" in the east of the map; "Saltings Fm" in the south-west of the map; "Moor Ho" in the north-east of the map. Letters in circles mark places: A in the south-west of the map; B in the north of the map. A key beside the map explains: B road, minor road, railway, footpath, river or stream, built-up area, building, non-coniferous wood, contour (5 m interval), spot height in metres, cliff, shingle, place of worship with tower, parking, railway station, PH = public house, Sch = school. Below the map: a scale bar marked 0, 1 and 2 km (1 km is the width of one grid square) and a north arrow pointing to the top of the map.

Model answer

380213

Explanation

Read along the bottom first (eastings): the stream meets the coast just east of the 38 grid line, so 380. Then read up (northings): it is about three tenths of the way up the square that starts at 21, so 213. The usual errors are giving the northing first and giving only a four-figure reference.

Mark scheme
  1. 1 mark

    380213

    The stream reaches the coastline at 380213. Allow one either side in the third and sixth figures: accept 379-381 for the easting and 212-214 for the northing (e.g. 381213, 380212). The easting must come first: do not credit 213380. Do not credit a four-figure reference (3821) on its own.
Question 2

2 marks

Explain one threat that coastal flooding poses to the natural environment.

Model answer

When the sea floods freshwater wetlands behind the coast, the salt water kills plants and animals that cannot tolerate salt, such as reeds and freshwater fish, so the habitat changes or is lost.

Explanation

The first mark is for a threat to habitats or wildlife and the second for explaining its effect. The question asks about the natural environment, so points about homes and businesses do not score. Salt-water flooding and coastal squeeze are two of the most common threats.

Mark scheme
  1. 1 mark

    Identifies a valid threat to the natural environment, e.g. salt water floods freshwater habitats / soils become salty / habitats such as salt marsh or mudflat are squeezed between rising sea and defences / sand dunes are eroded / pollution from flooded sites

    Examples: Sea water floods freshwater wetlands and lagoons (1) killing plants and animals that cannot tolerate salt (1). Salt is left in the soil after a flood (1) so many plants cannot grow there for several years (1). Rising seas squeeze salt marsh against sea walls (coastal squeeze) (1) so wading birds lose feeding grounds (1). Storm waves erode sand dunes (1) destroying dune habitats and the nesting sites in them (1). Floodwater carries sewage or oil from flooded sites (1) polluting rivers and habitats (1). Allow any other appropriate response.

  2. 1 mark

    Develops the threat, e.g. explains the effect on plants, animals or habitats

    The answer must be about the natural environment. Do not credit threats to people, homes or the economy (e.g. 'houses are damaged', 'farmers lose money') unless linked to an effect on habitats or wildlife.

Question 3

3 marks

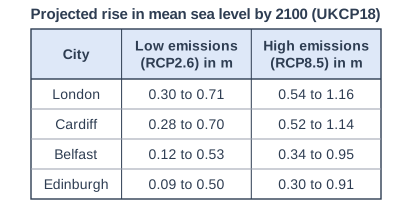
Figure 1 shows projected rises in mean sea level by 2100 for four UK cities, compared with the average for 1981-2000, under low and high greenhouse gas emissions (Met Office, UKCP18 projections, 2023 factsheet).

Using Figure 1, compare the projected rise in sea level under low emissions with the projected rise under high emissions.

Projected rise in mean sea level by 2100 (UKCP18). Table with columns "City", "Low emissions (RCP2.6) in m", "High emissions (RCP8.5) in m". City: London; Low emissions (RCP2.6) in m: 0.30 to 0.71; High emissions (RCP8.5) in m: 0.54 to 1.16 | City: Cardiff; Low emissions (RCP2.6) in m: 0.28 to 0.70; High emissions (RCP8.5) in m: 0.52 to 1.14 | City: Belfast; Low emissions (RCP2.6) in m: 0.12 to 0.53; High emissions (RCP8.5) in m: 0.34 to 0.95 | City: Edinburgh; Low emissions (RCP2.6) in m: 0.09 to 0.50; High emissions (RCP8.5) in m: 0.30 to 0.91.

Model answer

The projected rise is greater under high emissions than under low emissions in all four cities. For example, the highest value for London is 1.16 m under high emissions but only 0.71 m under low emissions, and every city's upper value is above 0.9 m under high emissions whereas none is above 0.71 m under low emissions. The ranges are also wider under high emissions (about 0.6 m compared with about 0.4 m), although the pattern between the cities is the same in both, with London and Cardiff highest and Edinburgh lowest.

Explanation

Each mark needs a statement that compares the two scenarios, such as 'higher under high emissions' or 'wider range', and data help to make it precise. Listing the values for each city without comparing them earns no marks. The command word is 'compare', so explaining why the scenarios differ is not credited.

Mark scheme
  1. 1 mark

    A first valid comparative statement, e.g. the rise is greater under high emissions in every city / the upper values under high emissions (0.91 to 1.16 m) are all higher than any upper value under low emissions (0.50 to 0.71 m) / the lowest values are about 0.2 m higher under high emissions (e.g. London 0.54 m compared with 0.30 m) / the ranges are wider under high emissions (about 0.6 m compared with about 0.4 m) / the pattern is the same in both, with London and Cardiff highest and Edinburgh lowest / the ranges overlap (e.g. 0.54 to 0.71 m for London appears in both)

    Award 1 mark for each comparative statement, up to 3 marks. Each statement must compare the two scenarios (e.g. 'higher', 'whereas', 'more than', 'both'). Data can be part of a comparative statement and manipulated data are credited (e.g. 'London's highest value is 0.45 m more under high emissions'). Do not credit data lifts directly from the figure without comparison (e.g. 'London is 0.30 to 0.71 m'). Do not credit explanation (e.g. why high emissions cause more warming).

  2. 1 mark

    A second, different comparative statement (from the list above)

    Do not credit the same comparison repeated for another city (e.g. 'London is higher under high emissions' and 'Cardiff is higher under high emissions' count as one point).

  3. 1 mark

    A third, different comparative statement (from the list above)

    Allow any other appropriate comparative statement.

Question 4

4 marks

Explain how Integrated Coastal Zone Management (ICZM) can reduce conflict over how a coastline is managed.

Model answer

ICZM manages a whole stretch of coast, usually a sediment cell, as one unit instead of each town protecting itself. This means the effects of a defence in one place on beaches further along the coast are considered before it is built, so one community does not protect itself by starving another of sediment. It also brings together all the stakeholders, such as residents, farmers, businesses and conservation groups, so their views are heard and a compromise can be agreed, such as holding the line at a town while allowing farmland to be realigned.

Explanation

Two linked ways, each developed, or one way developed three times, can reach 4 marks. The key ideas are planning at the scale of the sediment cell and involving every stakeholder. A definition of ICZM on its own earns only 1 mark because it does not explain how conflict is reduced.

Mark scheme
  1. 1 mark

    Identifies a valid way ICZM reduces conflict, e.g. it plans for a whole stretch of coast or sediment cell rather than one place / it involves all the stakeholders in decisions / it balances economic, social and environmental needs

    Mark as 1 + (1+1+1) or (1+1)+(1+1): award 1 mark for each way ICZM reduces conflict and further marks for development, up to 4 marks. Examples: ICZM manages a whole sediment cell as one unit (1) so the effect of defences in one place on places down-drift is considered before they are built (1) which avoids starving another community's beach of sediment (1) and so avoids conflict between neighbouring places (1). It brings together residents, farmers, businesses, conservation groups and councils (1) so all views are heard and a compromise can be agreed, e.g. holding the line at towns while realigning farmland (1). It balances economic, social and environmental needs (1) so no single group's interests dominate the plan (1). Allow any other appropriate response.

  2. 1 mark

    Develops the first way

    Development marks need a clear link to reducing conflict.

  3. 1 mark

    Identifies a second way, or develops the first way further

    Do not credit a definition of ICZM with no link to conflict beyond the first mark.

  4. 1 mark

    Develops the second way (or further develops the first)

    Two ways must be different if two ways are given.

Ready to try the rest? Every answer you write is marked against the mark scheme, so you can see exactly where the marks are.

Study Helper Hints first, answers after you try

Stuck on this one? Ask for a hint and I’ll point you in the right direction, without giving the answer away. Once you’ve checked your answer, I’ll show you how the marks are awarded.