Tropical storms: distribution, formation and structure
Practise 32 exam-style questions on Tropical storms: distribution, formation and structure for AQA GCSE Geography (Paper 1). Write your answer as you would in the exam and get it marked in seconds against the mark scheme, point by point, with an AI tutor on hand if you get stuck.
32 questions
1–12 marks each
Instant marking
No sign-up needed
20 questions, marked as you go
Sample questions with model answers
Here are 4 of the questions in this topic, each with a model answer, an explanation of why it earns the marks and the mark scheme an examiner would use.
Question 1
1 mark
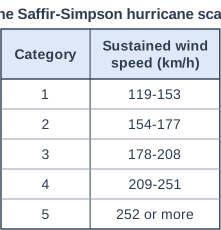
Figure 1 shows the Saffir-Simpson scale, which is used to classify hurricanes.
A hurricane has sustained wind speeds of 230 km/h. Using Figure 1, state the category of this hurricane.
Model answer
Category 4.
Explanation
230 km/h lies within the range 209-251 km/h, which is Category 4. The scale goes from Category 1 (at least 119 km/h, the speed at which a storm becomes a hurricane) up to Category 5 (252 km/h or more).
Mark scheme
1 mark
Category 4
Accept '4'. Do not accept more than one category.
Question 2
2 marks
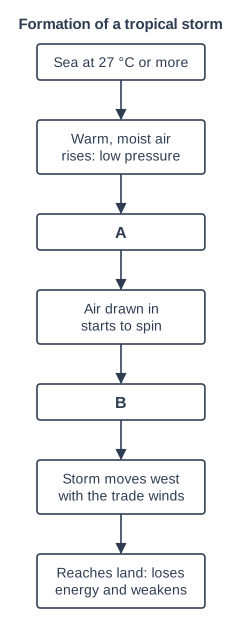
Figure 1 shows stages in the formation and development of a tropical storm. Two stages are missing, labelled A and B.
Describe the stages that should be in boxes A and B.
Model answer
A: The rising air cools and the water vapour condenses, forming towering cumulonimbus clouds and releasing latent heat that powers the storm. B: Cold air sinks in the centre of the spinning storm, forming the calm, clear eye.
Explanation
Rising warm, moist air must cool and condense before clouds form, and condensation releases the heat that drives the storm. Once the system is spinning strongly, air sinks in the centre to form the eye, which is why box B comes after the spin begins.
Mark scheme
1 mark
A: the rising air cools and condenses, forming (cumulonimbus) clouds and releasing heat (latent heat) that powers the storm
Accept 'condensation forms towering clouds' or 'latent heat is released'. Do not accept just 'clouds' without condensation or cooling.
1 mark
B: cold air sinks in the centre of the storm, forming the eye (calm, clear)
Accept 'the eye forms in the centre'.
Question 3
4 marks
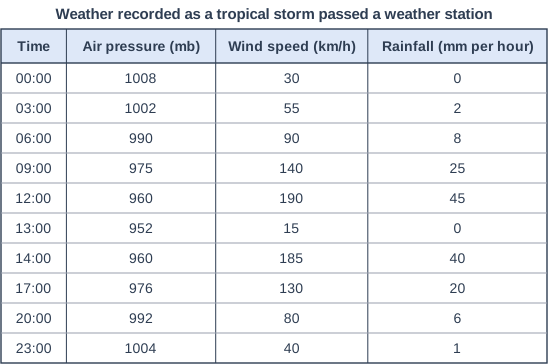
Figure 1 shows the weather recorded at a weather station as a tropical storm passed over it.
Describe how the weather changed as the storm passed over the weather station. Use data from Figure 1 in your answer.
Model answer
As the storm approached, the air pressure fell steadily from 1008 mb at 00:00 to a low of 952 mb at 13:00. The wind speed rose from 30 km/h to 190 km/h at 12:00, and rainfall increased to 45 mm per hour. At 13:00 the weather suddenly became calm, with winds of only 15 km/h and no rain. By 14:00 the wind was back up to 185 km/h with 40 mm of rain per hour, and then the wind, rain and pressure all gradually returned towards their earlier values, with winds of 40 km/h and pressure of 1004 mb by 23:00.
Explanation
Describe the sequence in order and quote figures with units for pressure, wind and rain. The pattern of rising winds, a sudden calm and then violent winds again shows the eyewall, the eye and the eyewall passing over the station.
Mark scheme
1 mark
Air pressure fell steadily from 1008 mb at 00:00 to its lowest, 952 mb, at 13:00, then rose again to 1004 mb by 23:00
max 4; 1 mark per accurate point; max 2 if no data are used.
1 mark
Wind speed increased from 30 km/h at 00:00 to a peak of 190 km/h at 12:00
1 mark
Then the wind suddenly dropped to only 15 km/h at 13:00 (calm)
1 mark
The wind then rose again to 185 km/h at 14:00 and decreased to 40 km/h by 23:00
1 mark
Rainfall increased to a maximum of 45 mm per hour at 12:00, stopped (0 mm) at 13:00, returned at 40 mm per hour at 14:00, then decreased to 1 mm by 23:00
1 mark
The pattern is roughly symmetrical: the strongest winds and heaviest rain came just before and just after the calm period
Question 4
6 marks
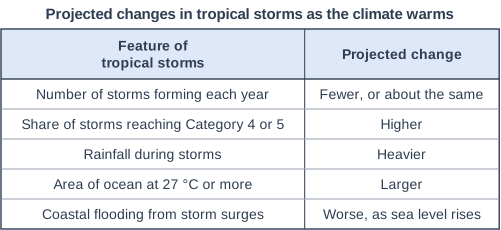
Figure 1 shows how scientists expect tropical storms to change as the climate warms.
Using Figure 1 and your own knowledge, explain how climate change might affect the distribution, frequency and intensity of tropical storms.
Model answer
Climate change is warming the oceans. Figure 1 shows that the area of ocean at 27 °C or more is expected to become larger, so the distribution of tropical storms may spread further from the Equator, affecting places that rarely experience them today. For example, Hurricane Catarina hit southern Brazil in 2004, the first hurricane recorded in the South Atlantic. Storm seasons may also become longer as the sea stays warm for more of the year.
The frequency of storms may not increase. Figure 1 suggests that the number forming each year may fall or stay about the same, possibly because changes in the winds high in the atmosphere will tear some developing storms apart. Scientists are less certain about this than about other changes.
The intensity of storms is likely to increase. Warmer seas mean more evaporation, so more water vapour condenses in the storm and releases more latent heat, giving it more energy. Figure 1 shows that a higher share of storms is expected to reach Category 4 or 5. Warmer air can also hold more moisture, so rainfall will be heavier, and because sea levels are rising, storm surges will flood further inland. So even if there are not more storms, the ones that do form may be stronger and more damaging.
Explanation
The question names three aspects, so a Level 3 answer covers distribution, frequency and intensity separately and explains each. Notice from Figure 1 that frequency may not rise: stronger rather than more storms is the main expected change.
Mark scheme
6 marks
Levels of response (6 marks). Level 3 (5-6 marks): detailed, well-developed explanation of possible changes in all three of distribution, frequency and intensity, each linked to the effects of warming (e.g. warmer seas, more moisture, sea-level rise); makes effective use of Figure 1. Level 2 (3-4 marks): clear explanation of changes in two of the three aspects, or all three with limited explanation; some use of Figure 1. Level 1 (1-2 marks): basic statements about how storms may change, with little explanation; may simply copy Figure 1. 0 marks: nothing worthy of credit.
Indicative content (not a checklist; credit other valid points): Distribution: Figure 1 shows the area of ocean at 27 °C or more is expected to be larger, so storms may form or reach further from the Equator and affect places that rarely have them now (e.g. Hurricane Catarina, which hit southern Brazil in 2004, was the first recorded hurricane in the South Atlantic); storms may reach their peak strength further from the Equator; the storm season may become longer. Frequency: Figure 1 shows the number of storms may fall or stay about the same; changes in upper winds (wind shear) and drier air may stop some storms forming; scientists are less certain about frequency. Intensity: warmer seas mean more evaporation, more condensation and more latent heat, so more energy; Figure 1 shows a higher share of storms reaching Category 4 or 5; warmer air holds more moisture (about 7% more for each 1 °C of warming), so rainfall will be heavier, increasing flooding; sea-level rise (from thermal expansion and melting ice) means storm surges will reach further inland.
Ready to try the rest? Every answer you write is marked against the mark scheme, so you can see exactly where the marks are.
Ctrl + Enter to check
AI TutorHints first, answers after you try
Hi! Stuck? Ask me for a hint and I’ll help you work it out. Once you’ve checked your answer I can explain exactly where the marks are.