
Level:
Correct: 0
Incorrect: 0
Marks: 0/0
Exam Practice
Subject:
Topics:
AQA GCSE Geography (Paper 1) Smart practice A mixed round aimed at your weak spots
Unit 1
The challenge of natural hazards
Unit 2
The living world
Unit 3
Physical landscapes in the UK
Unit 4
Geographical skills: OS maps
Avg
score:
–
Topics
done:
0/32

Deforestation

Practise 30 exam-style questions on Deforestation for AQA GCSE Geography (Paper 1). Write your answer as you would in the exam and get it marked in seconds against the mark scheme, point by point, with an AI tutor on hand if you get stuck.

  • 30 questions
  • 1–12 marks each
  • Instant marking
  • No sign-up needed
20 questions, marked as you go

Sample questions with model answers

Here are 4 of the questions in this topic, each with a model answer, an explanation of why it earns the marks and the mark scheme an examiner would use.

Question 1

1 mark

Which one of the following best describes subsistence farming in a tropical rainforest?

A Growing crops such as soya on large farms to sell abroad
B Rearing large herds of beef cattle for export
C Growing food mainly to feed the farmer and their family
D Growing oil palms on plantations owned by large companies

Give the letter of the correct answer.

Model answer

C

Explanation

Subsistence farming produces food mainly for the farmer's own family, with little or nothing left to sell. Options A, B and D are all types of commercial farming, which grows crops or rears animals to sell for profit.

Mark scheme
  1. 1 mark

    C (growing food mainly to feed the farmer and their family)

    accept the letter or the option written out; do not accept more than one answer
Question 2

2 marks

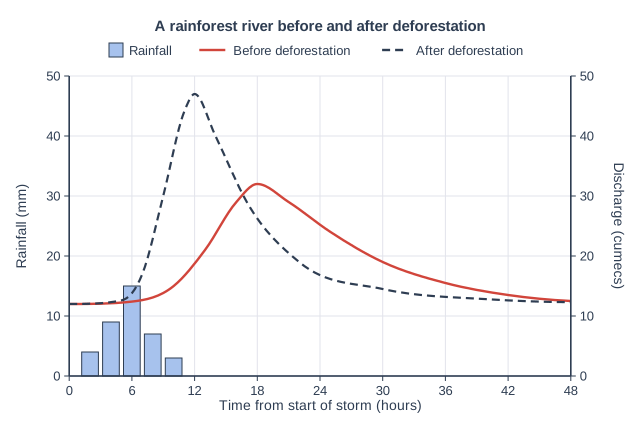
Figure 1 shows storm hydrographs for the same storm on a river in a tropical rainforest drainage basin, before and after much of the basin was deforested.

Calculate the difference between the lag times of the two hydrographs.

A rainforest river before and after deforestation. Storm hydrograph. Rainfall is drawn as blue bars rising from the time axis, read on the left axis (Rainfall in mm, 0 to 50, numbered every 10); river discharge is drawn as two curves, read on the right axis ("Discharge (cumecs)", 0 to 50, numbered every 10). Time is "Time from start of storm (hours)" along the bottom, 0 to 48, numbered every 6. A key shows Rainfall (bars), Before deforestation (solid red line) and After deforestation (dashed line). Rainfall bars (centred on their times): 2 h 4 mm, 4 h 9 mm, 6 h 15 mm, 8 h 7 mm, 10 h 3 mm. "Before deforestation" (solid) discharge (a smooth curve through these points): 0 h 12, 6 h 12.4, 10 h 15, 13 h 21, 16 h 29, 18 h 32, 21 h 29, 25 h 24, 30 h 19, 36 h 15.5, 42 h 13.5, 48 h 12.5 cumecs. "After deforestation" (dashed) discharge (a smooth curve through these points): 0 h 12, 5 h 12.6, 7 h 17, 9 h 30, 11 h 44, 12 h 47, 14 h 40, 17 h 29, 22 h 19, 30 h 14.5, 40 h 12.8, 48 h 12.3 cumecs.

Model answer

Peak rainfall is at 6 hours.
Before deforestation: peak discharge at 18 hours, so lag time = 18 − 6 = 12 hours.
After deforestation: peak discharge at 12 hours, so lag time = 12 − 6 = 6 hours.
Difference = 12 − 6 = 6 hours.

Explanation

Lag time is measured from peak rainfall (the tallest bar) to peak discharge, not from the start of the storm. After deforestation there is less interception and infiltration, so water reaches the river faster as surface runoff, giving a shorter lag time and a higher peak.

Mark scheme
  1. 1 mark

    Lag times read correctly: about 12 hours before deforestation and about 6 hours after deforestation (peak rainfall at 6 hours; peak discharges at 18 hours and 12 hours)

    correct answer with no working scores 2 marks

  2. 1 mark

    Difference = 6 hours (the lag time is 6 hours shorter after deforestation)

    accept 5-7 hours

Question 3

4 marks

Between 2004 and 2012 the area of rainforest cleared each year in the Brazilian Amazon fell by more than 80%. The rate then rose again until 2021.

Suggest reasons for these changes in the rate of deforestation.

Model answer

The fall between 2004 and 2012 was probably due to stronger government action. Brazil introduced a plan to tackle deforestation, using satellites to spot illegal clearance quickly so that officials could fine farmers and seize their equipment. Large protected areas and indigenous reserves were created, and the soya moratorium meant traders refused to buy soya grown on newly cleared land, so clearing forest became less profitable. Lower prices for beef and soya may also have reduced the demand for new land.

The rate rose again because enforcement became weaker. The Forest Code was changed in 2012 and later governments cut the budgets of environmental agencies, so illegal clearance was less likely to be punished. At the same time world demand for beef and soya stayed high, and illegal gold mining increased, so more forest was cleared.

Explanation

The command word 'suggest' means you should apply your knowledge to explain likely reasons. To reach Level 2 you must give reasons for both the fall and the rise and develop each one, for example 'satellite monitoring meant illegal clearance was spotted quickly, so farmers could be fined'. Listing reasons without explaining how they changed the rate stays in Level 1.

Mark scheme
  1. 4 marks

    Levels of response (4 marks).
    Level 2 (3-4 marks): clear, developed suggestions for both the fall between 2004 and 2012 and the later rise, e.g. linking government action, enforcement and demand for farm products to the changes in the rate; accurate use of terminology.
    Level 1 (1-2 marks): basic suggestions with simple, undeveloped points, or reasons for only one of the two changes.
    0 marks: nothing worthy of credit.

    Indicative content (not a checklist; credit other valid points): Fall 2004-2012: the government introduced an action plan against deforestation (from 2004); satellite monitoring detected illegal clearance quickly so officials could act; more fines, seizure of equipment and cattle, and arrests; large new protected areas and indigenous reserves were created; banks restricted loans to farmers who cleared land illegally; the soya moratorium (2006) meant traders would not buy soya from newly cleared land; beef companies agreed not to buy cattle from illegally cleared land; lower world prices for beef and soya reduced the incentive to clear land; international pressure and funding (e.g. the Amazon Fund). Rise to 2021: weaker enforcement and cuts to the budgets and staff of environmental agencies; changes to the Forest Code (2012) that forgave some past illegal clearance; government policies, especially after 2019, that favoured expanding farming and mining; rising world demand and prices for beef and soya; more illegal gold mining; land grabbing and fires used to clear land; road building and paving opening up new areas.

Question 4

6 marks

Explain how deforestation in tropical rainforests contributes to climate change.

Model answer

Tropical rainforests store vast amounts of carbon in their trees and soils, and through photosynthesis they absorb carbon dioxide from the atmosphere, acting as a carbon sink. When forest is cleared, usually by burning, the carbon stored in the trees is released very quickly as carbon dioxide. Trees that are felled and left to rot, and soils that are disturbed, release further carbon dioxide as they decompose. Where peat swamp forests are drained and burned, as in parts of Malaysia, the release is especially large.

At the same time, there are fewer trees left to absorb carbon dioxide, so the sink becomes smaller and more of the gas stays in the atmosphere. Carbon dioxide is a greenhouse gas: it absorbs long-wave radiation given off by the Earth's surface and re-radiates it, so the enhanced greenhouse effect traps more heat and global temperatures rise. In addition, cattle grazing on cleared land produce methane, a powerful greenhouse gas. Research suggests that parts of the south-eastern Amazon now release more carbon than they absorb, so deforestation is turning part of a carbon sink into a carbon source.

Explanation

There are two sides to explain: deforestation adds carbon to the atmosphere (burning and decomposition) and removes a sink that would take carbon out (photosynthesis). Level 3 answers link these to the enhanced greenhouse effect and global warming using correct terms such as 'carbon sink' and 'long-wave radiation'.

Mark scheme
  1. 6 marks

    Levels of response (6 marks).
    Level 3 (5-6 marks): detailed, well-developed explanation with clear chains of reasoning linking deforestation to increased greenhouse gases in the atmosphere and to the enhanced greenhouse effect; covers both the release of stored carbon and the loss of a carbon sink; accurate use of terminology.
    Level 2 (3-4 marks): clear explanation with some linked points, e.g. burning releases carbon dioxide, which traps heat.
    Level 1 (1-2 marks): basic explanation with simple, unlinked statements, e.g. trees absorb carbon dioxide.
    0 marks: nothing worthy of credit.

    Indicative content (not a checklist; credit other valid points): rainforest trees store huge amounts of carbon in their biomass; through photosynthesis they absorb carbon dioxide, acting as a carbon sink; burning to clear land releases the stored carbon quickly as carbon dioxide; felled trees and disturbed soils decompose, releasing more carbon dioxide; draining and burning peat swamp forest (e.g. in Malaysia and Indonesia) releases very large amounts of carbon; fewer trees remain to absorb carbon dioxide, so more stays in the atmosphere; carbon dioxide is a greenhouse gas that traps long-wave radiation, causing the enhanced greenhouse effect and global warming; deforestation is responsible for a significant share (roughly a tenth) of global greenhouse gas emissions; cattle on cleared land produce methane, a powerful greenhouse gas; research suggests parts of the south-eastern Amazon now release more carbon than they absorb; less transpiration means drier conditions, more fires and more carbon released (a positive feedback).

Ready to try the rest? Every answer you write is marked against the mark scheme, so you can see exactly where the marks are.

AI Tutor Hints first, answers after you try

Hi! Stuck? Ask me for a hint and I’ll help you work it out. Once you’ve checked your answer I can explain exactly where the marks are.