Practise 25 exam-style questions on Global atmospheric circulation for AQA GCSE Geography (Paper 1). Write your answer as you would in the exam and get it marked in seconds against the mark scheme, point by point, with an AI tutor on hand if you get stuck.
25 questions
1–12 marks each
Instant marking
No sign-up needed
20 questions, marked as you go
Sample questions with model answers
Here are 4 of the questions in this topic, each with a model answer, an explanation of why it earns the marks and the mark scheme an examiner would use.
Question 1
1 mark
Give the name of the belt of low pressure near the Equator where the north-east and south-east trade winds meet.
Model answer
The Inter-Tropical Convergence Zone (ITCZ).
Explanation
The trade winds from both hemispheres converge (meet) near the Equator, where strongly heated air rises. This zone of rising air and low pressure is called the Inter-Tropical Convergence Zone, and it brings heavy convectional rain and thunderstorms.
Mark scheme
1 mark
The Inter-Tropical Convergence Zone (ITCZ)
Accept ITCZ, Inter-Tropical Convergence Zone, equatorial low (pressure belt) or the doldrums. Do not accept just 'low pressure' or 'the Equator'.
Question 2
2 marks
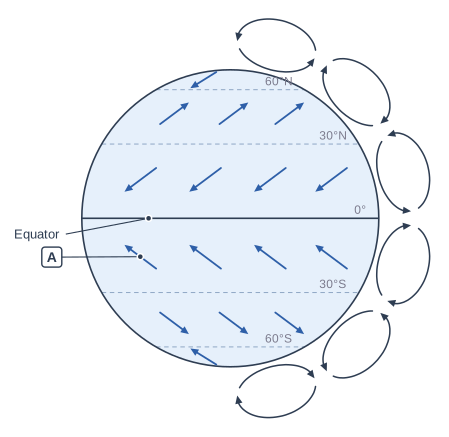
Figure 1 shows the general atmospheric circulation model.
Name the surface wind labelled A and state the direction it blows from.
Model answer
A is the south-east trade winds, which blow from the south-east towards the Equator.
Explanation
Between the Equator and 30°S surface air flows from the subtropical high towards the low pressure at the Equator. The Earth's rotation turns winds to the left in the southern hemisphere, so these trade winds blow from the south-east. Winds are always named after the direction they come from.
Mark scheme
1 mark
(South-east) trade winds
Accept 'trade winds' or 'trades'. Do not accept 'north-east trade winds', westerlies or polar easterlies.
1 mark
It blows from the south-east (towards the Equator)
Accept 'south-easterly'. Do not accept 'towards the south-east' or 'from the south'.
Question 3
4 marks
Using your knowledge of global atmospheric circulation, explain why the UK often has wet and windy weather.
Model answer
The UK lies between 50° and 60°N, close to the belt of low pressure at about 60°N. Here warm air moving north meets cold polar air at the polar front and is forced to rise. As it rises it cools and condenses, forming clouds and rain. Depressions form along this front and bring spells of heavy rain and strong winds. The UK's prevailing winds are the westerlies, which blow from the south-west across the Atlantic Ocean, so they pick up a lot of moisture and carry one depression after another towards the UK, making the weather wet, windy and changeable.
Explanation
The key is to connect the UK's latitude to the circulation model: rising air at 60°N gives low pressure and rain, and the south-westerly westerlies bring moist Atlantic air and depressions. Answers that only say 'the UK is surrounded by sea' do not use atmospheric circulation and stay in Level 1.
Mark scheme
4 marks
Levels of response (4 marks). Level 2 (3-4 marks): clear explanation that links the UK's position (about 50-60°N) to the low-pressure belt at about 60°N and/or the prevailing south-westerly winds, explaining why these bring rain and wind; accurate terminology. Level 1 (1-2 marks): basic explanation with simple statements, e.g. 'winds come from the sea', with little link to atmospheric circulation. 0 marks: nothing worthy of credit.
Indicative content (not a checklist; credit other valid points): the UK lies at about 50-60°N, close to the belt of low pressure at about 60°N; here warm air from the south meets cold polar air (the polar front) and is forced to rise; rising air cools and condenses, forming clouds and rain; depressions (low-pressure systems) form along the polar front and bring rain and strong winds; the prevailing winds are the westerlies, blowing from the south-west across the Atlantic Ocean, so they pick up moisture before reaching the UK; westerlies carry depressions towards the UK one after another, so the weather is changeable; air moving from high pressure at 30° to low pressure at 60° gives frequent strong winds, especially in autumn and winter.
Question 4
6 marks
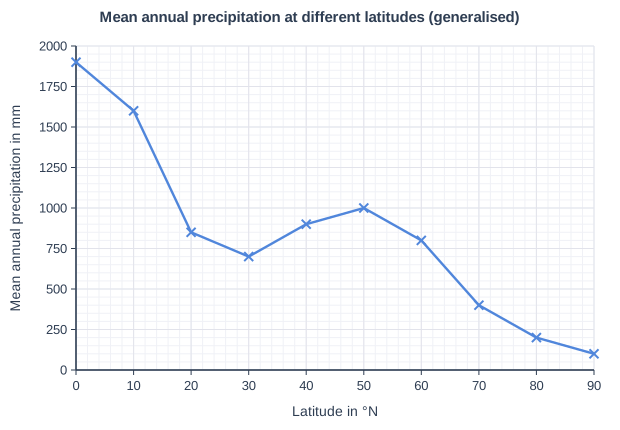
Figure 1 shows the mean annual precipitation at different latitudes in the northern hemisphere (generalised).
Using Figure 1 and your knowledge of global atmospheric circulation, explain the pattern of precipitation shown.
Model answer
Precipitation is highest at the Equator, at about 1900 mm a year. Here the Sun heats the ground intensely, so warm, moist air rises, creating low pressure. As it rises it cools and the water vapour condenses into cumulonimbus clouds, giving heavy convectional rain.
Precipitation falls to a low of about 700 mm at 30°N. This is where air that rose at the Equator sinks in the Hadley cell, creating high pressure. Sinking air warms up, so it does not condense into clouds, which is why many of the world's hot deserts are found at this latitude.
There is a second peak of about 1000 mm at 50°N. This is close to the belt of low pressure at about 60°N, where warm air from the south meets cold polar air and is forced to rise along the polar front. Depressions form here and the westerlies carry them eastwards, bringing frontal rain.
Near the North Pole precipitation falls to about 100 mm. Very cold, dense air sinks there, creating high pressure, and cold air holds little moisture, so the poles are very dry.
Explanation
Match each high on the graph to rising air and low pressure, and each low to sinking air and high pressure, then explain why rising air gives rain (cooling and condensation) and sinking air does not (warming). Quoting the values for each latitude shows effective use of the figure.
Mark scheme
6 marks
Levels of response (6 marks). Level 3 (5-6 marks): detailed, well-developed explanation of the highs and lows of precipitation, clearly linked to rising air and low pressure (Equator, about 60°N) and sinking air and high pressure (about 30°N, the pole); makes effective use of data from Figure 1. Level 2 (3-4 marks): clear explanation of some parts of the pattern with some links to the circulation model; some use of Figure 1. Level 1 (1-2 marks): basic explanation, or mainly description of the graph, with simple statements and little reference to atmospheric circulation. 0 marks: nothing worthy of credit.
Indicative content (not a checklist; credit other valid points): highest precipitation at the Equator (about 1900 mm), where intense heating makes warm, moist air rise, creating low pressure (the ITCZ); rising air cools and condenses, giving heavy convectional rain; precipitation falls to a low of about 700 mm at 30°N, where air in the Hadley cell sinks, creating high pressure; sinking air warms, so clouds do not form, which is why many hot deserts lie here; a second peak of about 1000 mm around 50°N, linked to the low-pressure belt at about 60°N where warm air meets cold polar air and is forced to rise (the polar front); depressions form here and bring frontal rain, carried by the westerlies; very low precipitation near the pole (about 100 mm), where cold, dense air sinks, creating high pressure, and cold air holds little moisture; the peaks and lows are not exactly at 0°, 30° and 60° because the belts move north and south with the seasons. Max Level 2 if only the equatorial and 30°N parts are explained.
Ready to try the rest? Every answer you write is marked against the mark scheme, so you can see exactly where the marks are.
Ctrl + Enter to check
AI TutorHints first, answers after you try
Hi! Stuck? Ask me for a hint and I’ll help you work it out. Once you’ve checked your answer I can explain exactly where the marks are.