Practise 26 exam-style questions on Desertification for AQA GCSE Geography (Paper 1). Write your answer as you would in the exam and get it marked in seconds against the mark scheme, point by point, with an AI tutor on hand if you get stuck.
26 questions
1–12 marks each
Instant marking
No sign-up needed
20 questions, marked as you go
Sample questions with model answers
Here are 4 of the questions in this topic, each with a model answer, an explanation of why it earns the marks and the mark scheme an examiner would use.
Question 1
1 mark
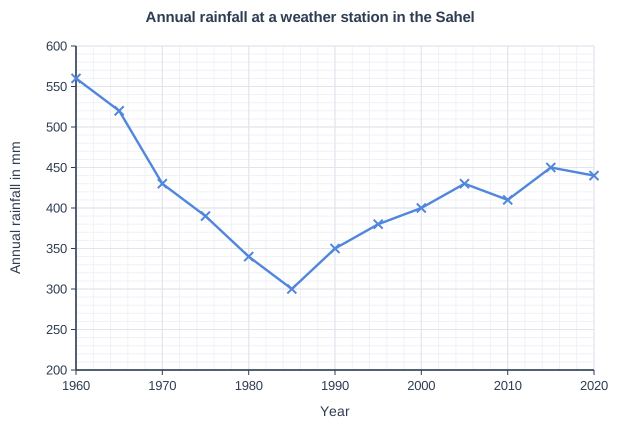
Figure 1 shows the annual rainfall at a weather station in the Sahel, recorded every five years between 1960 and 2020.
In which year shown on the graph was the annual rainfall lowest?
Model answer
1985 (300 mm).
Explanation
The lowest point on the line is 300 mm in 1985. This matches the severe droughts in the Sahel in the 1970s and 1980s, when rainfall fell well below the long-term average and the risk of desertification increased.
Mark scheme
1 mark
1985
Do not accept a range of years or 300 mm on its own.
Question 2
2 marks
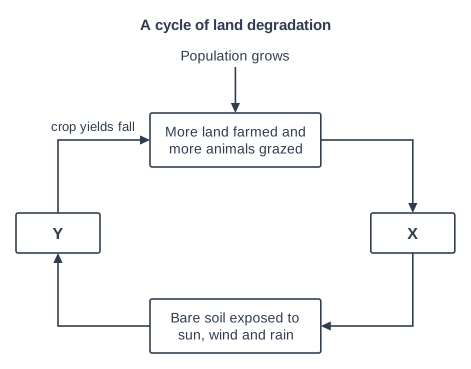
Figure 1 shows a cycle of land degradation that can lead to desertification. Two boxes are labelled X and Y.
Suggest what should go in box X and in box Y.
Model answer
X: vegetation is removed by overgrazing, over-cultivation and cutting trees for fuel. Y: soil erosion, as the fertile topsoil is blown or washed away.
Explanation
X must explain why the soil becomes bare (the vegetation has gone), and Y must explain why crop yields fall (the soil is eroded and loses its fertility). The cycle shows why desertification speeds up: falling yields force farmers to farm more land, which removes even more vegetation.
Mark scheme
1 mark
X: vegetation is removed / trees and grass are lost (through overgrazing, over-cultivation or cutting trees for fuel)
Accept overgrazing, over-cultivation or deforestation / removal of fuelwood if linked to loss of vegetation cover.
1 mark
Y: soil erosion / topsoil is blown or washed away (so the soil becomes infertile)
Accept 'soil loses nutrients / becomes infertile'. Do not accept 'drought'.
Question 3
4 marks
Explain how stone lines (sometimes called magic stones) can reduce the risk of desertification.
Model answer
Stone lines are rows of stones laid along the contours of gently sloping fields. When heavy rain falls, the stones slow down the water running over the surface, so more of it has time to soak into the soil instead of running off. The runoff also carries soil and organic matter, which is trapped behind the stones, so the fertile topsoil is kept on the field rather than being eroded. With more moisture and soil, crops and grass grow better, and the vegetation cover protects the ground even more. In Burkina Faso, where this method is widely used, yields have increased significantly. Because the stones are free, local and easy to place, farmers can build and repair the lines themselves, which makes them a good example of appropriate technology.
Explanation
The key processes are slowing runoff, increasing infiltration and trapping soil. A Level 2 answer links these steps to better plant growth and less erosion. Answers that just say the stones 'protect the soil' or 'are cheap' without explaining how they work stay in Level 1.
Mark scheme
4 marks
Levels of response (4 marks). Level 2 (3-4 marks): clear explanation of how stone lines work, with developed points linking their effect on runoff, infiltration and soil to reduced desertification; may refer to why they are appropriate technology. Level 1 (1-2 marks): basic explanation with simple statements (e.g. 'they stop soil being washed away'); little explanation of how they work. 0 marks: nothing worthy of credit.
Indicative content (not a checklist; credit other valid points): lines of stones are laid along the contours of gently sloping fields; in heavy rainstorms they slow down surface runoff; water has more time to infiltrate (soak into) the soil, so the soil holds more moisture; soil and organic matter carried by runoff are trapped behind the stones, so topsoil is not lost and soil erosion is reduced; with more water and soil, crops and grass grow better and yields rise (increases of up to about 50% have been reported in Burkina Faso); more vegetation protects the soil further; they are cheap and use local materials and labour, so they are appropriate technology that local people can build and maintain; often combined with zai planting pits. Credit an example such as Burkina Faso in the Sahel.
Question 4
6 marks
Explain how the different causes of desertification can be linked to one another.
Model answer
Many causes of desertification are linked through population growth. As the population increases, more food is needed, so farmers grow crops on the same land more often and move onto marginal land, causing over-cultivation. Families also keep larger herds, which leads to overgrazing. More people need more fuel for cooking, so more trees and shrubs are cut down for firewood. All three of these remove the vegetation cover, which exposes the soil to wind and rain and causes soil erosion.
Soil erosion then makes the other causes worse. As the fertile topsoil is lost, crop yields fall, so farmers clear even more land, and the cycle repeats.
Climate change is linked to the human causes too. When rainfall decreases and becomes less reliable, as in the Sahel droughts of the 1970s and 1980s, crops fail and pasture dies. Herders then concentrate their animals on the few remaining areas of grass, so overgrazing becomes much more severe, and farmers clear new land to replace failed fields. When wood runs out, people burn dung, so it is no longer used as manure and the soil becomes even less fertile. In this way the causes reinforce each other, which is why desertification can spread quickly.
Explanation
This question rewards linking, not listing. Level 3 answers show chains (population growth → overgrazing → vegetation loss → erosion → more land cleared) and explain how climate change and human activities make each other worse. Answers that describe each cause in a separate paragraph with no connections are Level 1 or low Level 2.
Mark scheme
6 marks
Levels of response (6 marks). Level 3 (5-6 marks): detailed, well-developed explanation of several clear links between causes (human and physical), showing how one cause leads to or worsens another, possibly as a cycle; accurate terminology and understanding. Level 2 (3-4 marks): clear explanation of some links between causes, with some development; may explain causes separately with only limited linking. Level 1 (1-2 marks): basic statements about causes with few or no links between them. 0 marks: nothing worthy of credit.
Indicative content (not a checklist; credit other valid points): population growth leads to more demand for food, so over-cultivation and overgrazing; more people need more fuel, so more trees are cut down; all of these remove vegetation, which leads to soil erosion; soil erosion lowers yields, so more land is cleared - a cycle; climate change brings less and less reliable rainfall and higher temperatures, so crops fail and pasture dies back; in a drought, animals concentrate on the remaining vegetation, so overgrazing becomes more severe; failed harvests push farmers onto marginal land; burning dung when wood runs out removes manure from the soil; loss of vegetation may reduce local evapotranspiration and rainfall, worsening drought; poverty means people cannot afford alternatives (e.g. fuel, fertiliser); e.g. in the Sahel the droughts of the 1970s and 1980s combined with rapid population growth.
Ready to try the rest? Every answer you write is marked against the mark scheme, so you can see exactly where the marks are.
Ctrl + Enter to check
AI TutorHints first, answers after you try
Hi! Stuck? Ask me for a hint and I’ll help you work it out. Once you’ve checked your answer I can explain exactly where the marks are.