Level:
Correct: 0
Incorrect: 0
Marks: 0/0
Exam Practice
Subject:
Topics:
AQA GCSE Geography (Paper 1) Smart practice A mixed round aimed at your weak spots
Unit 1
The challenge of natural hazards
Unit 2
The living world
Unit 3
Physical landscapes in the UK
Unit 4
Geographical skills: OS maps
Avg
score:
–
Topics
done:
0/32

Climate change: evidence, causes and effects

Practise 35 exam-style questions on Climate change: evidence, causes and effects for AQA GCSE Geography (Paper 1). Write your answer as you would in the exam and get it marked in seconds against the mark scheme, point by point, with an AI tutor on hand if you get stuck.

  • 35 questions
  • 1–12 marks each
  • Instant marking
  • No sign-up needed
20 questions, marked as you go

Sample questions with model answers

Here are 4 of the questions in this topic, each with a model answer, an explanation of why it earns the marks and the mark scheme an examiner would use.

Question 1

1 mark

The Maunder Minimum (about 1645 to 1715) was a long period when very few sunspots were seen on the Sun.

Which one of the following did it coincide with?

A The Medieval Warm Period
B The Little Ice Age
C The last glacial maximum
D The Industrial Revolution

Give the letter of the correct answer.

Model answer

B

Explanation

Fewer sunspots means slightly lower solar output, so the Maunder Minimum fits with the cold winters of the Little Ice Age, when the River Thames froze and frost fairs were held on it. The last glacial maximum was about 20 000 years ago, far earlier.

Mark scheme
  1. 1 mark

    B (the Little Ice Age)

    accept the letter or the option written out; do not accept more than one answer
Question 2

2 marks

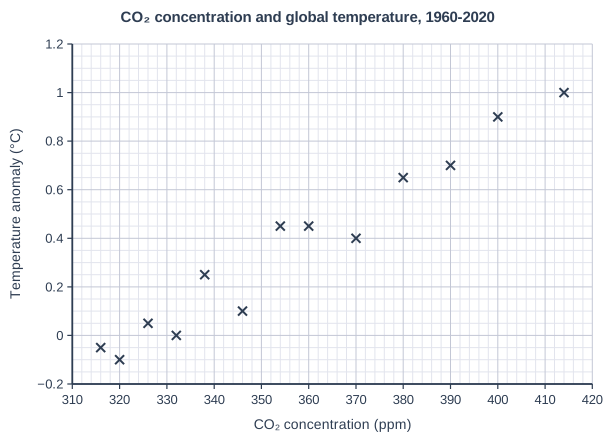
Figure 1 shows the concentration of carbon dioxide (CO₂) in the atmosphere and the global temperature anomaly (the difference from the 1951-1980 average) every five years from 1960 to 2020.

Describe the relationship shown in Figure 1.

CO₂ concentration and global temperature, 1960-2020. Scatter graph on a grid of small squares. The horizontal axis is "CO₂ concentration (ppm)", from 310 to 420, numbered every 10, with 5 small squares between numbered values (each small square is 2). The vertical axis is "Temperature anomaly (°C)", from −0.2 to 1.2, numbered every 0.2, with 4 small squares between numbered values (each small square is 0.05). 13 points are plotted as crosses: (316, −0.05), (320, −0.1), (326, 0.05), (332, 0), (338, 0.25), (346, 0.1), (354, 0.45), (360, 0.45), (370, 0.4), (380, 0.65), (390, 0.7), (400, 0.9) and (414, 1).

Model answer

There is a strong positive correlation: as the concentration of CO₂ increases, the temperature anomaly increases, from about -0.05 °C at 316 ppm to about 1.0 °C at 414 ppm.

Explanation

Describe the direction (positive) and strength (strong) of the correlation, and quote data if you can. A correlation on its own does not prove that one thing causes the other, but scientists understand the mechanism (the enhanced greenhouse effect), which is why this graph is strong evidence.

Mark scheme
  1. 1 mark

    Positive correlation / as CO₂ concentration increases, the temperature anomaly increases

    max 2

  2. 1 mark

    The correlation is strong / the points lie close to a straight line

  3. 1 mark

    Use of data, e.g. at about 316-320 ppm the anomaly is about -0.1 to 0 °C, but at about 414 ppm it is about 1.0 °C

Question 3

4 marks

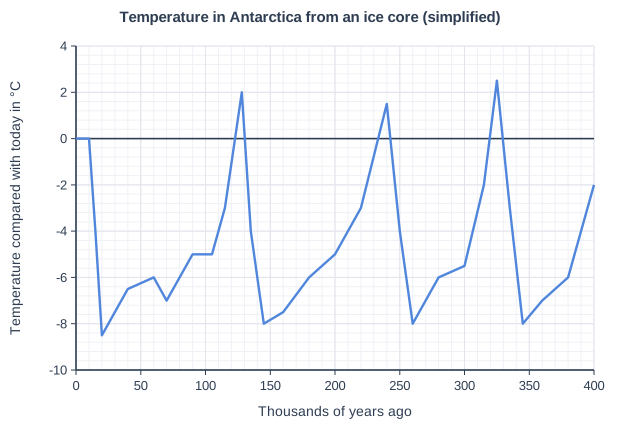
Figure 1 shows how temperature in Antarctica has changed over the last 400 000 years, compared with the temperature today. The data comes from an ice core and has been simplified.

Describe the pattern of temperature change shown in Figure 1.

Temperature in Antarctica from an ice core (simplified). Line graph of temperature compared with today in °C (y-axis, -10 to 4) against thousands of years ago (x-axis, 0 to 400). The line joins the points (0, 0), (10, 0), (15, -4), (20, -8.5), (40, -6.5), (60, -6), (70, -7), (90, -5), (105, -5), (115, -3), (128, 2), (135, -4), (145, -8), (160, -7.5), (180, -6), (200, -5), (220, -3), (240, 1.5), (250, -4), (260, -8), (280, -6), (300, -5.5), (315, -2), (325, 2.5), (335, -3), (345, -8), (360, -7), (380, -6), (400, -2).

Model answer

The temperature goes up and down in a repeated cycle of long cold glacial periods and short warm interglacial periods, roughly every 100 000 years. There are warm peaks about 325 000, 240 000 and 128 000 years ago and at the present day, when temperatures were up to about 2.5 °C warmer than today. In the coldest periods, such as about 20 000 years ago, temperatures were about 8.5 °C lower than today. Each warm period starts with a rapid rise in temperature, followed by a slower, uneven fall into the next glacial.

Explanation

Describe the overall pattern first (repeated cycles), then add detail: how often the cycles repeat, how cold and warm it got, and the shape of each cycle. Quoting data from the graph (temperatures and dates) earns marks, but do not explain the causes when the question only asks you to describe.

Mark scheme
  1. 1 mark

    Temperature rises and falls in a repeated pattern / cycles of cold (glacial) and warm (interglacial) periods

    max 4; 1 mark per valid point; up to 2 marks for accurate use of data from Figure 1; accept 'ice ages' for glacial periods

  2. 1 mark

    The cycles repeat roughly every 100 000 years / there are four warm peaks: about 325 000, 240 000 and 128 000 years ago and the present day

    accept 320-330, 235-245 and 125-130 thousand years ago

  3. 1 mark

    Cold (glacial) periods last much longer than the short warm (interglacial) periods

  4. 1 mark

    In the coldest periods temperatures were about 8-8.5 °C lower than today (e.g. about 20 000 years ago)

    accept -8 to -9 °C

  5. 1 mark

    The warmest peaks were about 1.5-2.5 °C warmer than today (e.g. about 325 000 or 128 000 years ago)

  6. 1 mark

    Warming at the end of each cold period is rapid, but cooling into the next cold period is slower / more gradual and irregular

  7. 1 mark

    The present warm (interglacial) period began about 15 000-10 000 years ago

Question 4

6 marks

Explain the effects of climate change on the environment.

Model answer

One effect is the melting of ice. As temperatures rise, glaciers in mountain areas such as the Alps and the Himalayas are retreating, and the Arctic sea ice is shrinking in summer. Polar bears use the sea ice as a platform to hunt seals, so as it disappears they find it harder to feed.

Warmer oceans also damage coral reefs. When the water stays too warm, corals expel the algae that live in them and turn white, which is called coral bleaching. The Great Barrier Reef has suffered several mass bleaching events, and if the coral dies, the fish and other species that depend on it decline.

Sea level rise, caused by thermal expansion and melting land ice, floods low-lying coastal habitats such as salt marshes and mangroves. On land, many species are moving towards the poles or uphill to stay in a suitable climate, but species that cannot move fast enough may become extinct. Hotter, drier conditions in some regions are causing more droughts and wildfires, which destroy habitats, while thawing permafrost in the tundra releases methane, which adds to warming.

Explanation

Level 3 answers explain several effects and link each one to the change that causes it (warmer seas → coral bleaching). Using named examples, such as the Great Barrier Reef or polar bears in the Arctic, adds detail. A list of effects without explanation stays in Level 1.

Mark scheme
  1. 6 marks

    Levels of response (6 marks).
    Level 3 (5-6 marks): detailed, well-developed explanation of a range of environmental effects, linking each to the change in climate that causes it; accurate terminology; may use examples of places or species.
    Level 2 (3-4 marks): clear explanation of some environmental effects, with some development; some links to the cause.
    Level 1 (1-2 marks): basic statements of effects, e.g. a list (ice melts, animals die) with little or no explanation.
    0 marks: nothing worthy of credit.

    Indicative content (not a checklist; credit other valid points): glaciers and ice sheets melt and retreat (e.g. the Alps, Himalayas, Greenland); Arctic sea ice is shrinking, so polar bears lose the sea ice they hunt from; sea level rise floods low-lying coastal habitats such as salt marshes and mangroves; warmer seas cause coral bleaching (e.g. the Great Barrier Reef); species migrate towards the poles or to higher altitudes as habitats warm, and those unable to move may become extinct; changes in the timing of seasons, e.g. earlier flowering and breeding, so food chains are disrupted; more droughts and wildfires (e.g. Australia, California) destroy habitats; some areas become wetter, with more flooding; desertification in areas such as the Sahel; thawing permafrost releases methane and damages tundra ecosystems; ocean acidification from extra carbon dioxide harms shellfish and coral.

Ready to try the rest? Every answer you write is marked against the mark scheme, so you can see exactly where the marks are.

AI Tutor Hints first, answers after you try

Hi! Stuck? Ask me for a hint and I’ll help you work it out. Once you’ve checked your answer I can explain exactly where the marks are.