Level:
Correct: 0
Incorrect: 0
Marks: 0/0
Exam Practice
Subject:
Topics:
AQA GCSE Geography (Paper 1) Smart practice A mixed round aimed at your weak spots
Unit 1
The challenge of natural hazards
Unit 2
The living world
Unit 3
Physical landscapes in the UK
Unit 4
Geographical skills: OS maps
Avg
score:
–
Topics
done:
0/32

Cold environment ecosystems

Practise 26 exam-style questions on Cold environment ecosystems for AQA GCSE Geography (Paper 1). Write your answer as you would in the exam and get it marked in seconds against the mark scheme, point by point, with an AI tutor on hand if you get stuck.

  • 26 questions
  • 1–12 marks each
  • Instant marking
  • No sign-up needed
20 questions, marked as you go

Sample questions with model answers

Here are 4 of the questions in this topic, each with a model answer, an explanation of why it earns the marks and the mark scheme an examiner would use.

Question 1

1 mark

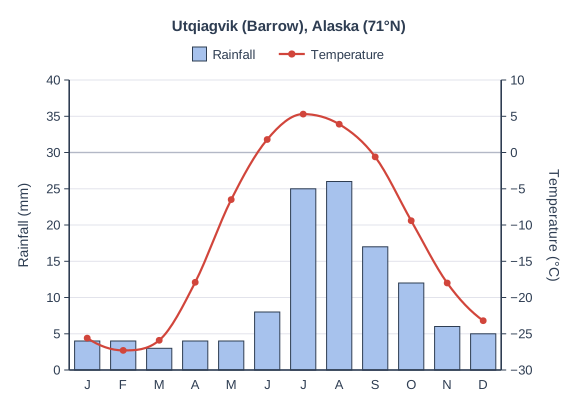
Figure 1 shows the climate of Utqiagvik (Barrow) in Alaska, which is in a tundra area.

How many months have a mean temperature above 0 °C?

Climate graph for Utqiagvik (Barrow), Alaska (71°N). It has blue bars for monthly rainfall, read on the left axis (Rainfall in mm, 0 to 40, numbered every 5), and a red line with a point for each month's mean temperature, read on the right axis (Temperature in °C, −30 to 10, numbered every 5). The months J F M A M J J A S O N D (January to December) run along the bottom; a key shows Rainfall (bars) and Temperature (line). A slightly darker gridline marks 0 °C. Rainfall Jan 4, Feb 4, Mar 3, Apr 4, May 4, Jun 8, Jul 25, Aug 26, Sep 17, Oct 12, Nov 6, Dec 5 mm; temperature Jan −25.6, Feb −27.3, Mar −25.9, Apr −17.9, May −6.5, Jun 1.8, Jul 5.3, Aug 3.9, Sep −0.6, Oct −9.4, Nov −18, Dec −23.2 °C.

Model answer

Three months (June, July and August).

Explanation

Only June (about 2 °C), July (about 5 °C) and August (about 4 °C) are above freezing; September is just below 0 °C. This very short period above freezing is when the active layer thaws and plants can grow, which is why the growing season in the tundra is so short.

Mark scheme
  1. 1 mark

    3 (June, July and August)

    Accept 3 or three. The months do not need to be named.

Question 2

2 marks

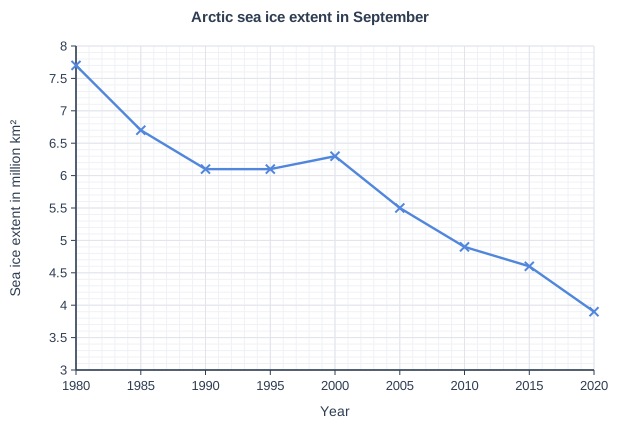
Figure 1 shows the approximate extent of Arctic sea ice each September between 1980 and 2020.

Calculate the percentage decrease in September sea ice extent between 1980 and 2020. Give your answer to one decimal place.

Arctic sea ice extent in September. Line graph of sea ice extent in million km² (y-axis, 3 to 8) against year (x-axis, 1980 to 2020). The line joins the points (1980, 7.7), (1985, 6.7), (1990, 6.1), (1995, 6.1), (2000, 6.3), (2005, 5.5), (2010, 4.9), (2015, 4.6), (2020, 3.9).

Model answer

Decrease = 7.7 - 3.9 = 3.8 million km²
Percentage decrease = 3.8 ÷ 7.7 × 100 = 49.4%

Explanation

Divide the decrease by the original (1980) value, not the final value. A fall of almost half in 40 years shows how quickly the Arctic is warming, which threatens species that depend on sea ice, such as polar bears and seals.

Mark scheme
  1. 1 mark

    Correct working: (7.7 - 3.9) ÷ 7.7 × 100 / 3.8 ÷ 7.7 × 100

    Values from the graph: 1980 = 7.7 million km², 2020 = 3.9 million km². Correct answer with no working scores full marks.

  2. 1 mark

    49.4%

    Accept 49.35% or 49%. Accept -49.4%. Do not accept 97.4% (dividing by 3.9).

Question 3

4 marks

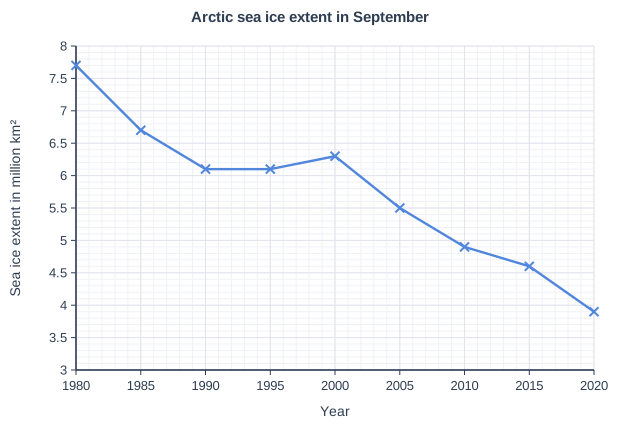
Figure 1 shows the approximate extent of Arctic sea ice each September between 1980 and 2020.

Using Figure 1, explain how the change shown could affect biodiversity in the Arctic.

Arctic sea ice extent in September. Line graph of sea ice extent in million km² (y-axis, 3 to 8) against year (x-axis, 1980 to 2020). The line joins the points (1980, 7.7), (1985, 6.7), (1990, 6.1), (1995, 6.1), (2000, 6.3), (2005, 5.5), (2010, 4.9), (2015, 4.6), (2020, 3.9).

Model answer

Figure 1 shows that the extent of September sea ice fell from about 7.7 million km² in 1980 to about 3.9 million km² in 2020, a loss of about half. This is a serious threat to species that depend on the ice. Polar bears hunt seals from the sea ice, so with less ice they have to go without food for longer, which means thinner bears, fewer cubs surviving and falling populations. Ringed seals need the ice to give birth and raise their pups, and walrus are forced onto crowded beaches. Algae that grow under the ice are the base of the Arctic food web, feeding zooplankton, fish and then seals, so losing the ice could disrupt the whole food web. Warmer, open water also lets species from further south move in and compete with Arctic species, so biodiversity in the Arctic is likely to fall.

Explanation

Level 2 answers use the data to show the scale of the change and explain specific effects on species and the food web, ideally with chains of consequences (less ice → fewer seals caught → polar bear numbers fall). General statements such as 'animals will lose their homes' are Level 1.

Mark scheme
  1. 4 marks

    Levels of response (4 marks).
    Level 2 (3-4 marks): clear explanation of how the loss of sea ice affects named species and the food web, with developed, linked points; uses data from Figure 1 to show the scale of the change.
    Level 1 (1-2 marks): basic explanation with simple statements (e.g. 'polar bears will die'); little or no use of Figure 1.
    0 marks: nothing worthy of credit.

    Indicative content (not a checklist; credit other valid points): September sea ice fell from about 7.7 million km2 in 1980 to about 3.9 million km2 in 2020 (about half), though not steadily; polar bears hunt seals from the sea ice, so less ice means longer periods without food, thinner bears, fewer cubs surviving and falling populations; ringed seals need sea ice to give birth and raise pups; walrus rest on sea ice and are forced onto crowded beaches; algae growing under the ice are the base of the food web (zooplankton, Arctic cod, seals), so the whole food web is disrupted; warmer, open water lets species from further south move in and compete with Arctic species; more open water allows shipping, fishing and oil exploration, bringing disturbance and pollution; overall, ice-dependent species decline, reducing biodiversity; some species, e.g. plankton in open water, may increase.

Question 4

6 marks

Explain why tundra areas have a greater biodiversity than polar areas.

Model answer

Tundra areas have a greater biodiversity mainly because their climate is less extreme. In the tundra, temperatures rise above 0 °C for two to four months in summer, whereas in polar areas such as interior Antarctica they stay below freezing all year and can fall below -50 °C in winter. In the tundra summer, the active layer thaws, so plants such as mosses, lichens, grasses, sedges and dwarf willow can root in the thin soil and grow during a short growing season of about two months. In polar areas there is little or no soil, and about 98% of Antarctica is covered by an ice sheet, so there is very little land where plants can grow at all. Antarctica has only two native flowering plants.

Because the tundra has more plants, it can support more herbivores, such as caribou, lemmings and Arctic hares, and these support predators, such as wolves, Arctic foxes and snowy owls. In polar areas, most animals, such as penguins and seals, depend on food from the sea and live near the coast.

The tundra is also joined to the continents further south, so many birds and caribou migrate into it each summer, whereas Antarctica is isolated by the Southern Ocean. For all these reasons the tundra supports many more species than polar areas.

Explanation

A comparative 'explain' question needs differences in conditions (temperature, thaw, soil, ice cover) linked to the number of species each environment can support. Level 3 answers link these through the food web: more plants support more herbivores and predators. Describing one environment only limits the answer to Level 2.

Mark scheme
  1. 6 marks

    Levels of response (6 marks).
    Level 3 (5-6 marks): detailed, well-developed explanation that clearly compares tundra and polar conditions and links the differences in climate, ground and soils to the number of plants and animals each can support; accurate use of examples.
    Level 2 (3-4 marks): clear explanation with some comparison and some development; may focus on only one environment.
    Level 1 (1-2 marks): basic statements (e.g. 'polar areas are colder'), with little explanation of why this affects biodiversity.
    0 marks: nothing worthy of credit.

    Indicative content (not a checklist; credit other valid points): tundra has two to four months above 0 degrees C, whereas polar areas stay below freezing all year (interior Antarctica can average below -50 degrees C in winter); in the tundra the active layer thaws in summer, so plants can root and grow in a short growing season of about 50-60 days; tundra has thin soils, polar areas have little or no soil; most of the land in polar areas is covered by ice sheets (about 98% of Antarctica), leaving little exposed land; polar areas are drier and windier; more plant species (mosses, lichens, grasses, sedges, dwarf shrubs) support more herbivores (caribou, lemmings, hares) and predators (wolves, foxes, owls); in polar areas most life depends on the sea (penguins, seals) and is found at the coast; Antarctica has only two native flowering plants; tundra is joined to the continents further south, so species such as caribou and many birds can migrate in summer, whereas Antarctica is isolated by the Southern Ocean.

Ready to try the rest? Every answer you write is marked against the mark scheme, so you can see exactly where the marks are.

AI Tutor Hints first, answers after you try

Hi! Stuck? Ask me for a hint and I’ll help you work it out. Once you’ve checked your answer I can explain exactly where the marks are.