Level:
Correct: 0
Incorrect: 0
Marks: 0/0
Exam Practice
Subject:
Topics:
AQA GCSE Geography (Paper 1) Smart practice A mixed round aimed at your weak spots
Unit 1
The challenge of natural hazards
Unit 2
The living world
Unit 3
Physical landscapes in the UK
Unit 4
Geographical skills: OS maps
Avg
score:
–
Topics
done:
0/32

Flooding, hydrographs and flood management

Practise 34 exam-style questions on Flooding, hydrographs and flood management for AQA GCSE Geography (Paper 1). Write your answer as you would in the exam and get it marked in seconds against the mark scheme, point by point, with an AI tutor on hand if you get stuck.

  • 34 questions
  • 1–12 marks each
  • Instant marking
  • No sign-up needed
20 questions, marked as you go

Sample questions with model answers

Here are 4 of the questions in this topic, each with a model answer, an explanation of why it earns the marks and the mark scheme an examiner would use.

Question 1

1 mark

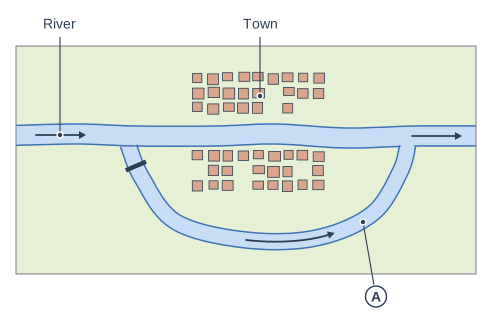
Figure 1 is a plan view of a town protected from flooding by a hard engineering strategy.

Name the hard engineering strategy labelled A.

Diagram of a flood relief channel (plan view). A plan view: a river flows from left to right through a built-up area of small buildings. Before the built-up area, a second channel leaves the river past a thick bar across its entrance, curves round below the buildings and joins the river again further on; an arrow along it points round the curve. Label A points to the channel that leaves the river upstream, curves round below the built-up area and rejoins it downstream; the label "Town" points to the built-up area of small buildings on both banks of the main river; the label "River" points to the main river flowing from left to right through the built-up area.

Model answer

A flood relief channel.

Explanation

A flood relief channel leaves the river upstream of a town, usually through a sluice gate, carries excess water around the town and rejoins the river downstream. The Jubilee River at Maidenhead is a UK example.

Mark scheme
  1. 1 mark

    Flood relief channel

    Accept relief channel / diversion channel / bypass channel / overflow channel. Do not accept 'channel' alone, 'straightening' or 'canal'.

Question 2

2 marks

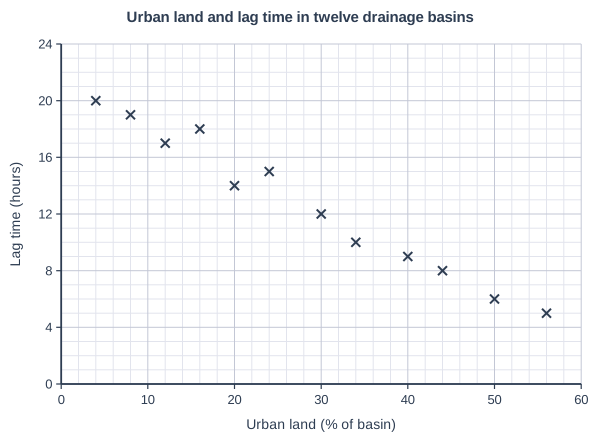
Figure 1 shows the percentage of urban land and the lag time of rivers in twelve drainage basins.

Describe the relationship shown in Figure 1.

Urban land and lag time in twelve drainage basins. Scatter graph on a grid of small squares. The horizontal axis is "Urban land (% of basin)", from 0 to 60, numbered every 10, with 5 small squares between numbered values (each small square is 2). The vertical axis is "Lag time (hours)", from 0 to 24, numbered every 4, with 4 small squares between numbered values (each small square is 1). 12 points are plotted as crosses: (4, 20), (8, 19), (12, 17), (16, 18), (20, 14), (24, 15), (30, 12), (34, 10), (40, 9), (44, 8), (50, 6) and (56, 5).

Model answer

There is a strong negative correlation: as the percentage of urban land increases, the lag time decreases. For example, the basin with 4% urban land has a lag time of 20 hours, but the basin with 56% urban land has a lag time of only 5 hours.

Explanation

Describe the direction (negative) and strength (strong) of the relationship and support it with data from the graph. You only need to describe it here; the reason is that urban surfaces and drains send water to the river more quickly.

Mark scheme
  1. 1 mark

    Negative correlation / as the percentage of urban land increases, the lag time decreases

    max 2

  2. 1 mark

    Strong (fairly strong) correlation / the points lie close to a line

  3. 1 mark

    Data quoted to support the relationship, e.g. 4% urban has a lag time of 20 hours but 56% urban has a lag time of 5 hours

    Accept readings within one small square.

Question 3

4 marks

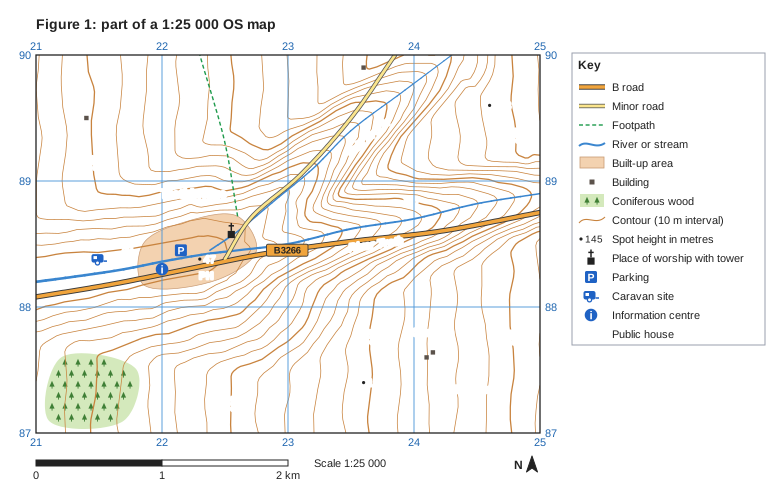
Figure 1 is part of a 1:25 000 Ordnance Survey (OS) map of the area around the village of Trethbridge.

Using Figure 1, suggest why Trethbridge is at risk of flooding.

Figure 1: part of a 1:25 000 OS map. Ordnance Survey map extract at a scale of 1:25 000. Blue grid lines divide it into 4 by 3 squares, each 1 km across; the eastings 21, 22, 23, 24, 25 are printed along the top and bottom (increasing to the east) and the northings 87, 88, 89, 90 up both sides (increasing to the north). Brown contour lines show the height of the land every 10 m, with every 50 m line drawn thicker; heights printed on contour lines: 50 m, 100 m, 150 m, 200 m, 250 m. Spot heights (a dot with the height in metres): 47 in the west of the map; 243 in the north-east of the map; 197 in the south of the map. Water (blue): a river runs between the east edge and the west edge; a stream runs between the north edge and the centre of the map. Roads and paths: the B3266 (B road) runs between the west edge and the east edge; a minor road runs between the centre of the map and the north edge; a footpath (green dashed lines). Land use: a built-up area (shaded orange) in the west of the map; 4 separate buildings (small black squares); coniferous woodland (green with tree symbols) in the south-west of the map. Symbols: caravan site in the west of the map; parking in the west of the map; place of worship with tower in the centre of the map; information centre in the west of the map; "PH" (public house) in the centre of the map. Names printed: "Trethbridge" in the west of the map; "River Treth" in the east of the map; "Vale Brook" in the north of the map; "Treth Moor" in the south-east of the map; "Carn Fm" in the south-east of the map. A key beside the map explains: B road, minor road, footpath, river or stream, built-up area, building, coniferous wood, contour (10 m interval), spot height in metres, place of worship with tower, parking, caravan site, information centre, PH = public house. Below the map: a scale bar marked 0, 1 and 2 km (1 km is the width of one grid square) and a north arrow pointing to the top of the map.

Model answer

Trethbridge is built on the valley floor exactly where Vale Brook joins the River Treth, at about 223884, so after heavy rain water from two valleys arrives at the village at the same time. The village is low-lying, at about 47 m (spot height at 223883), but the land upstream rises steeply to over 250 m on Treth Moor. The contours are very close together on the valley sides, so rainwater would run off quickly with little time to infiltrate, giving a short lag time and a sudden rise in river level. There is almost no woodland upstream to intercept rainfall. Buildings, the car park at 221884 and the caravan site at 215883 are right beside the river, and the roads and buildings themselves add impermeable surfaces.

Explanation

Strong answers combine site (a confluence on a narrow valley floor), relief (steep slopes and a high, open catchment) and land use (buildings and tourist facilities next to the river), each supported with map evidence. This setting is typical of villages hit by flash floods.

Mark scheme
  1. 4 marks

    Levels of response (4 marks).
    Level 2 (3-4 marks): clear suggestions with linked points explaining how physical and human features shown on the map increase the flood risk to Trethbridge; effective use of map evidence (grid references, heights, features).
    Level 1 (1-2 marks): basic suggestions with simple statements, e.g. 'it is next to a river'; little or no map evidence.
    0 marks: nothing worthy of credit.

    Indicative content (not a checklist; credit other valid points): Trethbridge is built where Vale Brook joins the River Treth (confluence at about 223884), so water from two valleys arrives at the same place; the village is low-lying, about 47-61 m (spot height 47 m at 223883), while the land upstream rises to about 260 m (e.g. 262 m on Treth Moor near 250870); the valley sides are steep (contours close together, about 1 in 3 near 239894), so rain runs off quickly with little time to infiltrate, giving a short lag time; the narrow V-shaped valleys funnel water towards the village; the upland is open moorland with almost no woodland upstream (the only wood is in square 2187), so there is little interception; upland areas usually receive high rainfall; the village is on the narrow valley floor right beside the rivers, with the car park (221884), public house (223882) and caravan site (215883) close to the river; roads (B3266 along the valley floor) and the built-up area are impermeable surfaces that increase runoff; a flash flood is possible.

Question 4

6 marks

Explain why soft engineering strategies are often considered more sustainable than hard engineering strategies for managing river flooding.

Model answer

A sustainable strategy meets people's needs now without harming the environment or creating problems for the future. Soft engineering is often more sustainable because it works with natural processes instead of trying to control the river.

For example, planting trees increases interception and infiltration, so less water reaches the river quickly, and the trees also create habitats and store carbon. River restoration lets the river meander and flood its wetlands, storing water naturally and increasing biodiversity. Flood plain zoning stops new homes being built in high-risk areas, which avoids damage and costs in the future, while flood warnings are cheap and save lives.

Hard engineering, such as dams, embankments and straightening, is usually very expensive to build and maintain. It can damage ecosystems, for example when dams trap sediment, and it often moves the problem downstream by sending water away faster. It can also give people a false sense of security, encouraging more building on the flood plain, which increases the damage if the defences fail.

However, soft engineering is not perfect: trees take many years to grow, farmland may be lost to flooding and existing buildings may not be protected. So it is more sustainable in the long term, but it is often used alongside some hard engineering.

Explanation

Define sustainability and then explain, with specific strategies, the environmental, economic and social reasons soft engineering scores well. Contrasting it with the drawbacks of hard engineering, and noting soft engineering's own limits, gives the developed answer needed for Level 3.

Mark scheme
  1. 6 marks

    Levels of response (6 marks).
    Level 3 (5-6 marks): detailed, well-developed explanation of why soft engineering is more sustainable, with linked points covering environmental, economic and social aspects and contrasting them with hard engineering; accurate references to specific strategies; may recognise limitations of soft engineering.
    Level 2 (3-4 marks): clear explanation of some reasons, with some reference to specific strategies; may cover only one or two aspects of sustainability.
    Level 1 (1-2 marks): basic statements, e.g. 'soft engineering is cheaper and natural'; little explanation.
    0 marks: nothing worthy of credit.

    Indicative content (not a checklist; credit other valid points): sustainable means meeting the needs of people today without harming future generations or the environment; soft engineering works with natural processes rather than trying to control the river; planting trees increases interception and infiltration, reducing runoff, and also stores carbon and creates habitats; river restoration and allowing wetlands to flood store water naturally and increase biodiversity; flood plain zoning stops new building in high-risk areas, so damage and future costs are avoided; flood warnings and preparation are cheap and save lives; soft strategies are usually cheaper to set up and maintain than dams, embankments or relief channels; they do not move the flood problem downstream as straightening and embankments can; hard engineering is expensive, needs maintenance, can fail when overtopped, can damage ecosystems (e.g. dams trapping sediment) and may encourage building on flood plains by giving a false sense of security; limitations: soft engineering may not protect existing buildings, trees take years to grow, land may be lost to flooding, and it may not cope with extreme floods.

Ready to try the rest? Every answer you write is marked against the mark scheme, so you can see exactly where the marks are.

AI Tutor Hints first, answers after you try

Hi! Stuck? Ask me for a hint and I’ll help you work it out. Once you’ve checked your answer I can explain exactly where the marks are.