Level:
Correct: 0
Incorrect: 0
Marks: 0/0
Exam Practice
Subject:
Topics:
AQA GCSE Geography (Paper 1) Smart practice A mixed round aimed at your weak spots
Unit 1
The challenge of natural hazards
Unit 2
The living world
Unit 3
Physical landscapes in the UK
Unit 4
Geographical skills: OS maps
Avg
score:
–
Topics
done:
0/32

Managing climate change

Practise 31 exam-style questions on Managing climate change for AQA GCSE Geography (Paper 1). Write your answer as you would in the exam and get it marked in seconds against the mark scheme, point by point, with an AI tutor on hand if you get stuck.

  • 31 questions
  • 1–12 marks each
  • Instant marking
  • No sign-up needed
20 questions, marked as you go

Sample questions with model answers

Here are 4 of the questions in this topic, each with a model answer, an explanation of why it earns the marks and the mark scheme an examiner would use.

Question 1

1 mark

Which one of the following was the main aim of the Paris Agreement, signed in 2015?

A To stop all countries using coal by 2020
B To keep the rise in global temperature well below 2 °C above pre-industrial levels, and try to limit it to 1.5 °C
C To plant one billion trees in every continent
D To make only high-income countries reduce their greenhouse gas emissions

Give the letter of the correct answer.

Model answer

B

Explanation

The Paris Agreement was signed by nearly every country in the world. Unlike the earlier Kyoto Protocol, which only set targets for richer countries, it asks every country to set its own targets, so option D describes Kyoto more closely than Paris.

Mark scheme
  1. 1 mark

    B (keep the rise in global temperature well below 2 °C above pre-industrial levels, aiming for 1.5 °C)

    accept the letter or the option written out; do not accept more than one answer
Question 2

2 marks

Give two ways in which farmers could adapt to more frequent droughts.

Model answer

Farmers could grow drought-resistant varieties of crops, and they could build stone lines across their fields to trap rainwater so that it soaks into the soil.

Explanation

Adaptation in farming means changing what is grown or how it is grown so that harvests survive drier conditions. Low-cost methods such as stone lines and mulching are especially important for poor farmers who cannot afford irrigation systems.

Mark scheme
  1. 1 mark

    Grow drought-resistant crop varieties (e.g. drought-tolerant maize, sorghum, millet)

    max 2; 1 mark per way

  2. 1 mark

    Use drip irrigation / more efficient irrigation

  3. 1 mark

    Harvest and store rainwater (e.g. tanks, small dams, ponds)

  4. 1 mark

    Build stone lines (bunds) or terraces to slow run-off and help water soak into the soil

    accept 'magic stones' / diguettes

  5. 1 mark

    Cover the soil with mulch to reduce evaporation

  6. 1 mark

    Change planting dates to match the rainy season

  7. 1 mark

    Keep hardier animals (e.g. goats or camels instead of cattle)

  8. 1 mark

    Plant trees among crops (agroforestry) to give shade and protect the soil

Question 3

4 marks

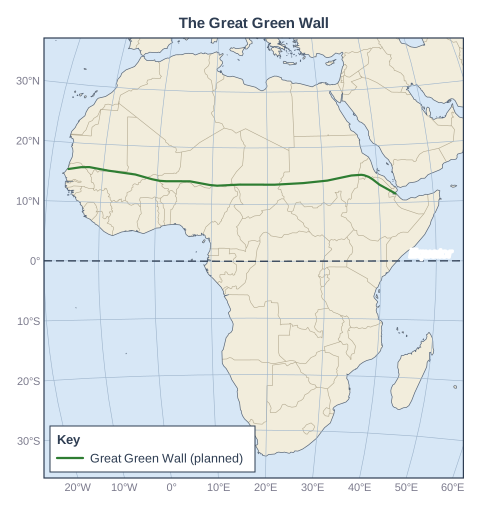
Figure 1 shows the planned route of the Great Green Wall, a scheme to plant a wide belt of trees and other vegetation across Africa.

Using Figure 1, suggest how the Great Green Wall could help to mitigate climate change and help people to adapt to it.

Map of Africa, titled "The Great Green Wall". Lines of latitude: the Equator (0°), drawn dashed and labelled "Equator". Lines of latitude and longitude are drawn every 10°, with their values (°N/°S and °E/°W) printed round the edge. Lines drawn: a line from Senegal to the coast of Djibouti, heading generally east (key: "Great Green Wall (planned)"). The key (in a box on the map) shows: "Great Green Wall (planned)".

Model answer

The trees and plants in the Great Green Wall would absorb carbon dioxide through photosynthesis and store the carbon, so it would help to mitigate climate change by acting as a carbon sink. Figure 1 shows that the wall runs across Africa from Senegal to Djibouti along the southern edge of the Sahara, through the Sahel, where droughts and desertification are serious problems. The roots of the trees hold the soil together, reducing soil erosion, and the trees act as windbreaks and provide shade, so less water evaporates from the soil. This helps farmers grow crops and graze animals even as the climate gets drier. The trees also provide fruit, animal fodder and fuelwood, giving people food and income so they are less likely to have to migrate.

Explanation

This question needs both halves: mitigation (absorbing carbon dioxide) and adaptation (helping people cope with drought and desertification). Using the map to identify the Sahel and the edge of the Sahara shows why adaptation matters so much there.

Mark scheme
  1. 4 marks

    Levels of response (4 marks).
    Level 2 (3-4 marks): clear explanation of how the scheme helps both mitigation and adaptation, with developed points; uses Figure 1 to show understanding of its location (e.g. the southern edge of the Sahara / the Sahel).
    Level 1 (1-2 marks): basic explanation; simple points about mitigation or adaptation only; little or no use of Figure 1.
    0 marks: nothing worthy of credit.

    Indicative content (not a checklist; credit other valid points): mitigation: trees and plants absorb carbon dioxide through photosynthesis and store carbon, acting as a carbon sink; adaptation: Figure 1 shows it runs along the southern edge of the Sahara through the Sahel, an area at risk of drought and desertification; tree roots bind the soil and reduce soil erosion by wind and rain; trees act as windbreaks and give shade, reducing evaporation so soils keep more moisture; leaf litter adds nutrients, improving soil fertility so crops grow better; trees provide food, fodder for animals, fuelwood and products to sell (e.g. gum arabic), giving income; it creates jobs; it can reduce the need for people to migrate; it crosses about 11 countries from Senegal to Djibouti, so it can help many people; limitation: progress has been slower than planned and many young trees die in drought.

Question 4

6 marks

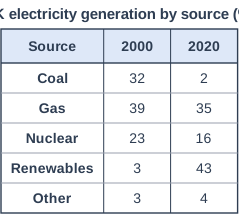
Figure 1 shows the percentage of the UK's electricity generated from different sources in 2000 and 2020.

Using Figure 1 and your own knowledge, explain how changes in energy production can help to mitigate climate change.

UK electricity generation by source (%). Table with columns "Source", "2000", "2020". Source: Coal; 2000: 32; 2020: 2 | Source: Gas; 2000: 39; 2020: 35 | Source: Nuclear; 2000: 23; 2020: 16 | Source: Renewables; 2000: 3; 2020: 43 | Source: Other; 2000: 3; 2020: 4.

Model answer

Burning fossil fuels in power stations releases carbon dioxide, the main greenhouse gas, so changing how electricity is produced can greatly reduce emissions. Figure 1 shows that the UK has done this. Coal, which releases the most carbon dioxide for each unit of electricity, fell from 32% of UK electricity in 2000 to only 2% in 2020, and the UK's last coal power station closed in 2024. Over the same period renewables rose from 3% to 43%.

Renewable sources such as wind, solar and hydroelectric power produce almost no carbon dioxide when generating electricity. The UK has built huge offshore wind farms, such as Hornsea in the North Sea, and many solar farms and rooftop panels. Gas still produced 35% of electricity in 2020, but gas releases roughly half as much carbon dioxide as coal, so switching from coal to gas also helped. Nuclear power is low-carbon too, although Figure 1 shows its share fell from 23% to 16% as old power stations closed.

These changes mean the UK's emissions from electricity have fallen dramatically. However, wind and solar are intermittent, so gas is still needed as back-up, and to reach net zero by 2050 the UK must replace this with more renewables, nuclear, energy storage or carbon capture.

Explanation

Level 3 combines accurate data from Figure 1 with an explanation of why the changes reduce emissions (renewables and nuclear release almost no carbon dioxide; coal releases the most). Own knowledge such as named wind farms or the closure of the last coal power station strengthens the answer.

Mark scheme
  1. 6 marks

    Levels of response (6 marks).
    Level 3 (5-6 marks): detailed, well-developed explanation of how switching from fossil fuels to alternative energy reduces greenhouse gas emissions; effective use of evidence from Figure 1 (with data); detailed own knowledge of types of alternative energy, which may include named UK examples.
    Level 2 (3-4 marks): clear explanation with some development; some use of Figure 1 and some own knowledge.
    Level 1 (1-2 marks): basic explanation; simple statements; little or no use of Figure 1.
    0 marks: nothing worthy of credit.

    Indicative content (not a checklist; credit other valid points): Figure 1: coal fell from 32% to 2% of UK electricity between 2000 and 2020; renewables rose from 3% to 43%; gas fell slightly from 39% to 35%; nuclear fell from 23% to 16%; coal releases the most carbon dioxide per unit of electricity, gas about half as much; renewables (wind, solar, HEP, tidal, biomass) and nuclear release very little carbon dioxide when generating; replacing coal with renewables and gas has greatly reduced emissions from UK electricity; the UK's last coal power station, Ratcliffe-on-Soar, closed in 2024; offshore wind farms such as Hornsea in the North Sea; solar panels on homes and farms; the UK Climate Change Act (2008) set a legal target, now net zero by 2050; problems: wind and solar are intermittent, so gas is still needed as back-up; nuclear has fallen as old stations close; energy production changes also include electric vehicles and heat pumps, which use low-carbon electricity.

Ready to try the rest? Every answer you write is marked against the mark scheme, so you can see exactly where the marks are.

AI Tutor Hints first, answers after you try

Hi! Stuck? Ask me for a hint and I’ll help you work it out. Once you’ve checked your answer I can explain exactly where the marks are.