
Level:
Correct: 0
Incorrect: 0
Marks: 0/0
Exam Practice
Course:
Topics:
AQA GCSE Statistics (Higher Paper 1) Smart practice A mixed round aimed at your weak spots
Unit 1
Planning and collecting data
Unit 2
Representing data
Section C: C1a (tabulation, tally, pictogram); Section E: E3d
Tabulation, tallies, pictograms and tables of data
Section C: C1a (pie chart), C1b (comparative pie chart)
Pie charts and comparative pie charts
Section C: C1a (stem and leaf diagram)
Stem and leaf diagrams
Section C: C2 (bar charts, bar line charts, line charts, frequency polygons)
Bar charts, line charts and frequency polygons
Section C: C2 (cumulative frequency charts)
Cumulative frequency diagrams
Section C: C2 (histograms), C3b
Histograms and frequency density
Section C: C2 (box plots); Section D: D3b; Section E: E5b
Box plots and outliers
Unit 3
Summarising data
Section D: D1a (mode, median, arithmetic mean)
Mode, median and mean
Section D: D1a (weighted mean, geometric mean), D1b
Weighted mean, geometric mean and choosing an average
Section D: D2; Section E: E5a
Skewness
Section D: D3a (range, quartiles, IQR, percentiles, interpercentile and interdecile range)
Range, quartiles, percentiles and interdecile range
Section D: D3a (standard deviation)
Standard deviation
Section C: C2 (time series); Section D: D1a (mean seasonal variation), D4; Section E: E6
Time series, moving averages and seasonal variation
Section C: C2 (scatter charts); Section D: D5
Scatter diagrams, lines of best fit and regression lines
Section D: D6; Section E: E9a, E9b, E9c
Spearman's rank correlation coefficient
Unit 4
Probability
Unit 5
Interpreting and evaluating results
Unit 6
Statistical enquiry cycle
3.6 Statistical enquiry cycle: 3.6.1 Initial planning, 3.6.2 Data collection
Statistical enquiry cycle: planning and data collection
3.6 Statistical enquiry cycle: 3.6.3 Processing and presentation, 3.6.4 Interpretation, 3.6.5 Evaluation
Statistical enquiry cycle: analysis and evaluation
Avg
score:
–
Topics
done:
0/39

Types of data and variables

Practise 15 exam-style questions on Types of data and variables for AQA GCSE Statistics (Higher Paper 1). Write your answer as you would in the exam and get it marked in seconds against the mark scheme, point by point, with the Study Helper on hand if you get stuck.

  • 15 questions
  • 1–5 marks each
  • Instant marking
  • No sign-up needed
15 questions, marked as you go

Sample questions with model answers

Here are 4 of the questions in this topic, each with a model answer, an explanation of why it earns the marks and the mark scheme an examiner would use.

Question 1

1 mark

At a vegetable show, the judges collect four sets of data about the pumpkins entered.

A   The masses of 40 pumpkins.
B   The masses of 40 pumpkins entered this year and the masses of 40 pumpkins entered last year.
C   The mass and the circumference of each of 40 pumpkins.
D   The mass, circumference, colour and variety of each of 40 pumpkins.

Which set of data is bivariate?

Choose your answer.

  • A
  • B
  • C
  • D

Model answer

C

Explanation

Bivariate data are pairs of values: two variables recorded for each item, which could be shown on a scatter diagram. C records the mass and the circumference of each pumpkin. A has only one variable, B is one variable recorded for two separate groups (not pairs of values), and D has four variables for each pumpkin, so it is multivariate.

Mark scheme
  1. 1 mark

    B1 for C

    Any other answer, or more than one answer, scores B0. B is the common wrong answer: it is two separate lists of the same variable, not two variables recorded for each pumpkin. D is multivariate (more than two variables for each pumpkin).
Question 2

2 marks

Jo recorded the finishing times of 240 runners in a 5 km fun run, to the nearest second.
She grouped the raw data into a frequency table with class intervals of 5 minutes.

Give one advantage and one disadvantage of grouping the data.

Model answer

Advantage: with 240 times, a grouped frequency table makes the overall distribution of the times (where most of them lie) much easier to see and to show on a histogram.
Disadvantage: the exact times are lost, so values such as the mean, the median and the fastest time can only be estimated from the table.

Explanation

Grouping raw data summarises a large data set, making patterns easier to see and diagrams easier to draw. The cost is a loss of information: once the values are in classes, statistics such as the mean and the median can only be estimated, and the exact smallest and largest values are unknown.

Mark scheme
  1. 1 mark

    B1 for an advantage, eg it is easier to see the pattern (shape or distribution) of the times / it is easier to summarise or display the data, eg in a histogram / 240 values are quicker to process

    oe. Do not accept 'it is neater' or 'it makes it easier' with no indication of what is easier.

  2. 1 mark

    B1 for a disadvantage, eg the exact (original) times are lost / the exact mean, median, range or fastest time can no longer be found - they can only be estimated

    oe. Accept 'detail is lost'. Accept 'averages are less accurate because they can only be estimated'. Do not accept 'it takes a long time to group' or 'it is less accurate' with no explanation of what is lost.

Question 3

3 marks

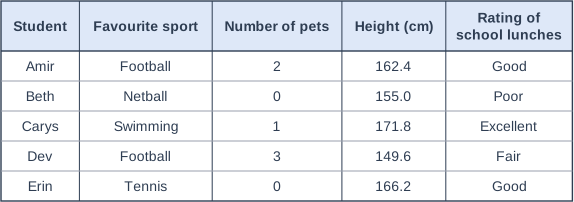
The table shows some of the data that Lily collected about the students in her class.
The rating of school lunches was chosen from Poor, Fair, Good or Excellent.

From the table, write down the name of
- a variable that gives continuous data
- a variable that gives discrete data
- a variable that gives ordinal data.

Table with columns "Student", "Favourite sport", "Number of pets", "Height (cm)", "Rating of school lunches". Student: Amir; Favourite sport: Football; Number of pets: 2; Height (cm): 162.4; Rating of school lunches: Good | Student: Beth; Favourite sport: Netball; Number of pets: 0; Height (cm): 155.0; Rating of school lunches: Poor | Student: Carys; Favourite sport: Swimming; Number of pets: 1; Height (cm): 171.8; Rating of school lunches: Excellent | Student: Dev; Favourite sport: Football; Number of pets: 3; Height (cm): 149.6; Rating of school lunches: Fair | Student: Erin; Favourite sport: Tennis; Number of pets: 0; Height (cm): 166.2; Rating of school lunches: Good.

Model answer

Continuous: height
Discrete: number of pets
Ordinal: rating of school lunches

Explanation

Continuous data are measured and can take any value in a range (height). Discrete data can take only particular values, usually counts (number of pets). Ordinal data are categories with a natural order (Poor, Fair, Good, Excellent). Favourite sport is qualitative (categorical) data, but its categories have no order, so it is not ordinal.

Mark scheme
  1. 1 mark

    B1 for continuous: height (cm)

    Do not accept more than one variable given for this answer. The three marks are independent.

  2. 1 mark

    B1 for discrete: number of pets

    Do not accept more than one variable given for this answer.

  3. 1 mark

    B1 for ordinal: rating of school lunches

    Do not accept favourite sport (it is qualitative, but its categories have no natural order).

Question 4

4 marks

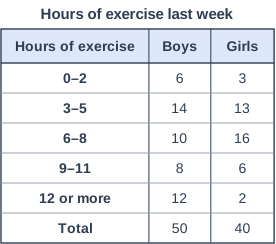
A student asked 50 boys and 40 girls how many hours of exercise they did last week, to the nearest hour.
The table shows the results.

A report merges the categories into '0-5 hours' and '6 or more hours'. It says 'Boys and girls do similar amounts of exercise.'

Use percentages to show what the merged categories give for the boys and for the girls.
Explain how merging the categories hides a difference between the boys and the girls.

Hours of exercise last week. Table with columns "Hours of exercise", "Boys", "Girls". Hours of exercise: 0–2; Boys: 6; Girls: 3 | Hours of exercise: 3–5; Boys: 14; Girls: 13 | Hours of exercise: 6–8; Boys: 10; Girls: 16 | Hours of exercise: 9–11; Boys: 8; Girls: 6 | Hours of exercise: 12 or more; Boys: 12; Girls: 2 | Hours of exercise: Total; Boys: 50; Girls: 40.

Model answer

Merged categories:
Boys: 0-5 hours: \(\dfrac{6 + 14}{50} \times 100 = 40\%\); 6 or more hours: \(\dfrac{30}{50} \times 100 = 60\%\)
Girls: 0-5 hours: \(\dfrac{3 + 13}{40} \times 100 = 40\%\); 6 or more hours: \(\dfrac{24}{40} \times 100 = 60\%\)
So the merged figures are the same for the boys and the girls.
But in the original table, \(\dfrac{12}{50} = 24\%\) of the boys did 12 or more hours, compared with only \(\dfrac{2}{40} = 5\%\) of the girls, while 40% of the girls did 6-8 hours compared with 20% of the boys.
The '6 or more hours' category puts 6-8, 9-11 and 12 or more hours together, so it hides the fact that a much larger proportion of the boys did a lot of exercise. Merging the categories loses this detail and makes the report's statement misleading.

Explanation

Merging categories makes data simpler, but it can hide important differences inside the merged groups. There are 50 boys and 40 girls, so comparisons must use percentages or proportions, not counts. Always check the original categories before accepting a conclusion based on merged ones.

Mark scheme
  1. 1 mark

    M1 for a correct method for the percentage in one merged category, eg \(\dfrac{20}{50} \times 100\) or \(\dfrac{16}{40} \times 100\) or \(\dfrac{30}{50}\) or \(\dfrac{24}{40}\)

    oe. 20 = 6 + 14 and 30 = 10 + 8 + 12 (boys); 16 = 3 + 13 and 24 = 16 + 6 + 2 (girls).

  2. 1 mark

    A1 for boys 40% (0-5 hours) and 60% (6 or more hours), and girls 40% and 60%

    oe. Accept proportions 0.4 and 0.6. Accept 40% for 0-5 hours for both with a statement that the rest (60%) did 6 or more hours.

  3. 1 mark

    B1 for a correct comparison from the original categories using percentages or proportions, eg 24% of the boys did 12 or more hours compared with only 5% of the girls / 40% of the girls did 6-8 hours compared with 20% of the boys

    Must use percentages or proportions, because the groups are different sizes: a comparison of counts only (eg 'more boys did 12 or more hours') scores B0. Any values stated must be correct. Boys: 12%, 28%, 20%, 16%, 24%; girls: 7.5%, 32.5%, 40%, 15%, 5%.

  4. 1 mark

    B1 for explaining in context that the wide '6 or more hours' category combines groups in which boys and girls differ, so the detail is lost, eg it hides the fact that a much larger proportion of boys than girls did a lot of exercise (12 or more hours)

    oe. Must explain that merging loses the detail within the merged category, in the context of boys' and girls' exercise. Do not accept 'merging loses detail' with no reference to this context.

Ready to try the rest? Every answer you write is marked against the mark scheme, so you can see exactly where the marks are.

Study Helper Hints first, answers after you try

Stuck on this one? Ask for a hint and I’ll point you in the right direction, without giving the answer away. Once you’ve checked your answer, I’ll show you how the marks are awarded.