Question 1
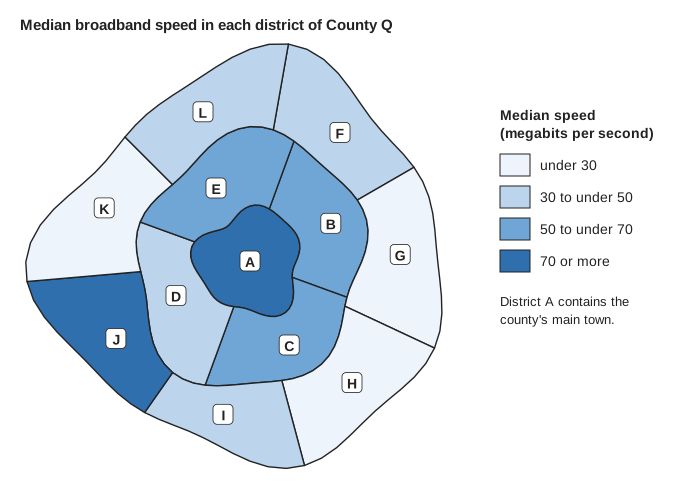
1 markThe choropleth map shows the median broadband speed in each district of County Q.
The same information could have been given in a table listing each district and its median speed.
Give one advantage of showing these data on a choropleth map rather than in a table.
Model answer
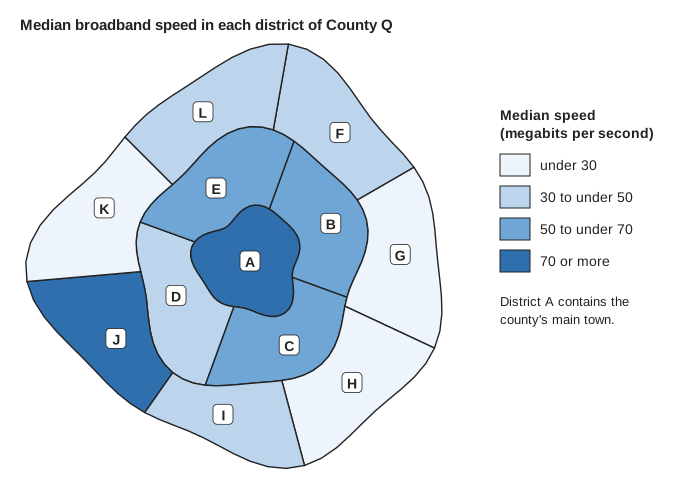
The map shows the speed class of each district in its real position, so you can see where in the county the speeds are fast or slow, for example that the slowest districts are on the edge of the county. A table would give the speeds but not where the districts are.
Explanation
A choropleth map uses shading to show the value of a variable for each area, so it shows both the value and the location, and geographical patterns can be seen at a glance. A table can give more exact values but does not show where the areas are. Answers that only mention the values, or say it is easy to read, miss the point about location.
Mark scheme
-
1 mark
B1 for the map shows where each district is, so you can see the geographical pattern of the speeds (where the faster and slower districts are)
oe, eg 'you can see which parts of the county have slow broadband'; 'it shows how the speed changes across the county / with distance from the main town'; 'you can see that neighbouring districts have similar speeds'. Must refer to location (where, position, area, part of the county, neighbouring) as well as the speed. 'It is easy to read', 'it is clearer', 'it looks better' or 'it shows the speeds' (no mention of location) scores B0. 'It shows the exact speeds' is false (a table would) and scores B0. Ignore any non-contradictory or irrelevant statements.