
Level:
Correct: 0
Incorrect: 0
Marks: 0/0
Exam Practice
Course:
Topics:
AQA GCSE Statistics (Higher Paper 1) Smart practice A mixed round aimed at your weak spots
Unit 1
Planning and collecting data
Unit 2
Representing data
Section C: C1a (tabulation, tally, pictogram); Section E: E3d
Tabulation, tallies, pictograms and tables of data
Section C: C1a (pie chart), C1b (comparative pie chart)
Pie charts and comparative pie charts
Section C: C1a (stem and leaf diagram)
Stem and leaf diagrams
Section C: C2 (bar charts, bar line charts, line charts, frequency polygons)
Bar charts, line charts and frequency polygons
Section C: C2 (cumulative frequency charts)
Cumulative frequency diagrams
Section C: C2 (histograms), C3b
Histograms and frequency density
Section C: C2 (box plots); Section D: D3b; Section E: E5b
Box plots and outliers
Unit 3
Summarising data
Section D: D1a (mode, median, arithmetic mean)
Mode, median and mean
Section D: D1a (weighted mean, geometric mean), D1b
Weighted mean, geometric mean and choosing an average
Section D: D2; Section E: E5a
Skewness
Section D: D3a (range, quartiles, IQR, percentiles, interpercentile and interdecile range)
Range, quartiles, percentiles and interdecile range
Section D: D3a (standard deviation)
Standard deviation
Section C: C2 (time series); Section D: D1a (mean seasonal variation), D4; Section E: E6
Time series, moving averages and seasonal variation
Section C: C2 (scatter charts); Section D: D5
Scatter diagrams, lines of best fit and regression lines
Section D: D6; Section E: E9a, E9b, E9c
Spearman's rank correlation coefficient
Unit 4
Probability
Unit 5
Interpreting and evaluating results
Unit 6
Statistical enquiry cycle
3.6 Statistical enquiry cycle: 3.6.1 Initial planning, 3.6.2 Data collection
Statistical enquiry cycle: planning and data collection
3.6 Statistical enquiry cycle: 3.6.3 Processing and presentation, 3.6.4 Interpretation, 3.6.5 Evaluation
Statistical enquiry cycle: analysis and evaluation
Avg
score:
–
Topics
done:
0/39

Comparing data sets using averages and spread

Practise 19 exam-style questions on Comparing data sets using averages and spread for AQA GCSE Statistics (Higher Paper 1). Write your answer as you would in the exam and get it marked in seconds against the mark scheme, point by point, with the Study Helper on hand if you get stuck.

  • 19 questions
  • 1–6 marks each
  • Instant marking
  • No sign-up needed
19 questions, marked as you go

Sample questions with model answers

Here are 4 of the questions in this topic, each with a model answer, an explanation of why it earns the marks and the mark scheme an examiner would use.

Question 1

1 mark

The standard deviation of the daily maximum temperatures in July was 1.8 °C in Town P and 4.3 °C in Town Q.

Use the standard deviations to compare the daily maximum temperatures in July in the two towns.

Model answer

The daily maximum temperatures in Town P in July were more consistent (varied less from day to day) than those in Town Q, because Town P's standard deviation is smaller.

Explanation

Standard deviation measures how spread out the values are around the mean, so a smaller standard deviation means more consistent temperatures. It says nothing about which town is warmer. Give the interpretation in words about temperatures, not just 'smaller standard deviation'.

Mark scheme
  1. 1 mark

    B1 for a comparison of spread in context, eg the daily maximum temperatures in Town P were more consistent / varied less than those in Town Q

    oe. Accept 'Town Q's daily maximum temperatures were more spread out / more variable'. Must be in context (temperatures, the weather). 'Town P has a smaller standard deviation' B0 (no interpretation). Any comment about which town is warmer B0 (standard deviation is not an average). Do not allow a correct statement with an incorrect statement.
Question 2

2 marks

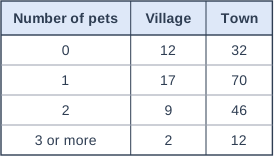
The table shows the number of pets owned by each household in a village and in a town.

Ravi says,
"Households in the town are more likely to have no pets than households in the village, because 32 households in the town have no pets but only 12 households in the village have no pets."

Is Ravi correct?
You must show your working.

Table with columns "Number of pets", "Village", "Town". Number of pets: 0; Village: 12; Town: 32 | Number of pets: 1; Village: 17; Town: 70 | Number of pets: 2; Village: 9; Town: 46 | Number of pets: 3 or more; Village: 2; Town: 12.

Model answer

Village: 12 + 17 + 9 + 2 = 40 households; \(\dfrac{12}{40} = 0.3\), so 30% have no pets.
Town: 32 + 70 + 46 + 12 = 160 households; \(\dfrac{32}{160} = 0.2\), so 20% have no pets.
Ravi is not correct: a greater proportion of village households (30%) have no pets than town households (20%), so village households are more likely to have no pets.

Explanation

When two groups are different sizes, compare proportions, not counts. There are four times as many households in the town, so more town households have no pets even though a smaller proportion of them do. Find each total first, then each percentage.

Mark scheme
  1. 1 mark

    M1 for \(\dfrac{12}{40}\) or \(\dfrac{32}{160}\) (or 0.3 or 30% or 0.2 or 20%)

    oe. The totals are 40 households (village) and 160 households (town).

  2. 1 mark

    A1 for No, with both proportions, eg 30% of village households have no pets but only 20% of town households, so village households are more likely to have no pets

    oe. The comparison must use proportions or percentages, not numbers of households: 'Reference to more or less implies number' and scores A0. The question says 'You must show your working': 'No' with no working scores 0. Accept fractions such as 3/10 and 1/5.

Question 3

3 marks

A swimming coach records the times, in seconds, that two swimmers take to swim 50 m freestyle in training sessions over a season.

Ruby: median 30.8 seconds, interquartile range 0.7 seconds
Zainab: median 31.5 seconds, interquartile range 1.4 seconds

The coach will choose the swimmer who is faster and more consistent for a race.

Compare the times of the two swimmers and decide which swimmer the coach should choose.

Model answer

On average Ruby swims faster than Zainab, because her median time is lower (30.8 s compared with 31.5 s).
Ruby's times are more consistent, because her interquartile range is smaller (0.7 s compared with 1.4 s).
The coach should choose Ruby, because she is both faster on average and more consistent.

Explanation

For times, lower is better, so the lower median shows the faster swimmer on average. The smaller interquartile range shows the more consistent swimmer. The decision should follow from both comparisons; a common error is to choose the swimmer with the higher median.

Mark scheme
  1. 1 mark

    B1 for a comparison of averages in context, eg on average Ruby swims faster / takes less time than Zainab (her median time is lower)

    oe. Lower times are better. Accept 'Ruby is faster, because her median time is lower'. 'Zainab is better because her median is higher' B0. 'Ruby's median is lower' with no interpretation B0. 'Ruby is faster' with no reference to average B0.

  2. 1 mark

    B1 for a comparison of spread in context, eg Ruby's times are more consistent / vary less than Zainab's (her interquartile range is smaller)

    oe. 'Ruby's IQR is smaller' with no interpretation B0. Reading the larger IQR as more consistent B0.

  3. 1 mark

    B1dep for Ruby, with a reason based on both comparisons, eg Ruby, because she is faster on average and more consistent

    Dependent on both previous B1 marks: there must be a comparison of both measures. 'Ruby' with no reason B0. Ignore any non-contradictory or irrelevant statements.

Question 4

5 marks

Ms Okafor recorded the reading speeds, in words per minute, of a random sample of 11 Year 7 students at her school.

148   156   170   175   181   190   194   199   205   214   238

For all Year 7 students in the county, the median reading speed is 182 words per minute and the interquartile range is 46 words per minute.

By working out the median and the interquartile range for the sample, compare the reading speeds of the students in the sample with the reading speeds of all Year 7 students in the county.

Model answer

There are 11 values, so the median is the 6th value and the quartiles are the 3rd and 9th values.
Median = 190 words per minute
Lower quartile = 170, upper quartile = 205, interquartile range = 205 - 170 = 35 words per minute
On average, the students in the sample read faster than Year 7 students in the county (median 190 compared with 182 words per minute).
The reading speeds of the students in the sample were more consistent (interquartile range 35 compared with 46 words per minute).

Explanation

With 11 ordered values, the median is the (11 + 1)/2 = 6th value and the quartiles are the 3rd and 9th values. Compare the sample's median and interquartile range with the county's, interpreting each in context ('read faster on average', 'more consistent').

Mark scheme
  1. 1 mark

    B1 for median = 190 (words per minute)

    The 6th value

  2. 1 mark

    M1 for lower quartile = 170 or upper quartile = 205

    The 3rd and 9th values

  3. 1 mark

    A1 for interquartile range = 35 (words per minute)

    205 - 170

  4. 1 mark

    B1ft for a comparison of the medians in context, eg on average, the students in the sample read faster than Year 7 students in the county

    oe. ft their median. Must use 'on average' / 'generally' or interpret the median. 'The sample median is higher' B0 (no interpretation). 'The students in the sample read faster' with no reference to average B0. Comparing the mean of the sample (188.2) instead of the median B0.

  5. 1 mark

    B1ft for a comparison of the interquartile ranges in context, eg the reading speeds of the students in the sample were more consistent / varied less than for all Year 7 students in the county

    oe. ft their interquartile range. Do not accept a comparison using the range. 'The sample IQR is smaller' with no interpretation B0. Ignore any non-contradictory or irrelevant statements.

Ready to try the rest? Every answer you write is marked against the mark scheme, so you can see exactly where the marks are.

Study Helper Hints first, answers after you try

Stuck on this one? Ask for a hint and I’ll point you in the right direction, without giving the answer away. Once you’ve checked your answer, I’ll show you how the marks are awarded.