
Level:
Correct: 0
Incorrect: 0
Marks: 0/0
Exam Practice
Course:
Topics:
AQA GCSE Statistics (Higher Paper 1) Smart practice A mixed round aimed at your weak spots
Unit 1
Planning and collecting data
Unit 2
Representing data
Section C: C1a (tabulation, tally, pictogram); Section E: E3d
Tabulation, tallies, pictograms and tables of data
Section C: C1a (pie chart), C1b (comparative pie chart)
Pie charts and comparative pie charts
Section C: C1a (stem and leaf diagram)
Stem and leaf diagrams
Section C: C2 (bar charts, bar line charts, line charts, frequency polygons)
Bar charts, line charts and frequency polygons
Section C: C2 (cumulative frequency charts)
Cumulative frequency diagrams
Section C: C2 (histograms), C3b
Histograms and frequency density
Section C: C2 (box plots); Section D: D3b; Section E: E5b
Box plots and outliers
Unit 3
Summarising data
Section D: D1a (mode, median, arithmetic mean)
Mode, median and mean
Section D: D1a (weighted mean, geometric mean), D1b
Weighted mean, geometric mean and choosing an average
Section D: D2; Section E: E5a
Skewness
Section D: D3a (range, quartiles, IQR, percentiles, interpercentile and interdecile range)
Range, quartiles, percentiles and interdecile range
Section D: D3a (standard deviation)
Standard deviation
Section C: C2 (time series); Section D: D1a (mean seasonal variation), D4; Section E: E6
Time series, moving averages and seasonal variation
Section C: C2 (scatter charts); Section D: D5
Scatter diagrams, lines of best fit and regression lines
Section D: D6; Section E: E9a, E9b, E9c
Spearman's rank correlation coefficient
Unit 4
Probability
Unit 5
Interpreting and evaluating results
Unit 6
Statistical enquiry cycle
3.6 Statistical enquiry cycle: 3.6.1 Initial planning, 3.6.2 Data collection
Statistical enquiry cycle: planning and data collection
3.6 Statistical enquiry cycle: 3.6.3 Processing and presentation, 3.6.4 Interpretation, 3.6.5 Evaluation
Statistical enquiry cycle: analysis and evaluation
Avg
score:
–
Topics
done:
0/39

Pie charts and comparative pie charts

Practise 15 exam-style questions on Pie charts and comparative pie charts for AQA GCSE Statistics (Higher Paper 1). Write your answer as you would in the exam and get it marked in seconds against the mark scheme, point by point, with the Study Helper on hand if you get stuck.

  • 15 questions
  • 1–5 marks each
  • Instant marking
  • No sign-up needed
15 questions, marked as you go

Sample questions with model answers

Here are 4 of the questions in this topic, each with a model answer, an explanation of why it earns the marks and the mark scheme an examiner would use.

Question 1

1 mark

A charity spends its money on four things: projects, fundraising, staff and running costs.
For its annual report, it wants a diagram that shows what proportion of its spending last year went on each of these.

Give one reason why a pie chart is more suitable than a bar chart for this purpose.

Model answer

A pie chart shows the whole of the charity's spending as one circle, so the size of each sector shows that item's proportion of the total spending. A bar chart shows the amounts, and you would have to add them up and divide to find each proportion.

Explanation

Pie charts are designed for data that are parts of a whole: the angle of each sector shows its share of the total. Bar charts are better for comparing the actual amounts. A vague answer such as 'it is clearer' does not say what the advantage is.

Mark scheme
  1. 1 mark

    B1 for a pie chart shows each type of spending as a proportion (share) of the total spending

    oe, eg 'the whole circle is the total, so you can see what fraction of the money went on each thing'; 'it shows how the total is split up'; 'you can see at a glance that projects are, say, more than half of the spending'. Must refer to the proportion, share or fraction of the whole (or total). Do not accept 'it is easier to read', 'it is clearer', 'it looks better', 'it is more accurate' or 'it shows the amounts' with no reference to the whole (B0); a bar chart shows the actual amounts better. Ignore any non-contradictory or irrelevant statements.
Question 2

2 marks

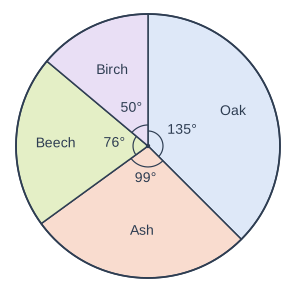
Lucy recorded the type of each of the 40 trees in a small wood.
She drew this pie chart to show her results.

Explain why Lucy's pie chart cannot be correct.

Pie chart. A circle divided into sectors, drawn clockwise from the top (12 o'clock): Oak, 135° (printed); Ash, 99° (printed); Beech, 76° (printed); Birch, 50° (printed). Each printed angle is marked with a small arc at the centre.

Model answer

There are 40 trees, so each tree is represented by \(360 \div 40 = 9^\circ\). Every angle must therefore be a multiple of 9°.
Beech: \(76 \div 9 = 8.44...\), which is not a whole number of trees (Birch: \(50 \div 9 = 5.55...\) trees).
So Lucy's pie chart cannot be correct, even though its angles add up to 360°.

Explanation

With 40 trees, each tree is 9° of the pie chart, so the angle of every sector must be a multiple of 9° for it to stand for a whole number of trees. Two of Lucy's angles, 76° and 50°, are not. Checking that the angles add up to 360° is not enough to show that a pie chart is correct.

Mark scheme
  1. 1 mark

    M1 for \(360 \div 40\) (= 9° for each tree) or \(76 \div 9\) (= 8.4...) or \(\dfrac{76}{360} \times 40\) (= 8.4...) or \(\dfrac{50}{360} \times 40\) (= 5.5...)

    oe. May be implied by a correct explanation, eg '76 is not a multiple of 9'. The other two sectors are correct: Oak 135° = 15 trees and Ash 99° = 11 trees.

  2. 1 mark

    A1 for the Beech sector (76°) or the Birch sector (50°) is not a multiple of 9°, so it does not represent a whole number of trees

    oe, eg '76° would be 8.44 trees, which is impossible'; 'Birch would be 5.56 trees'. Either sector is enough. 'The angles do not add up to 360°' is false (135 + 99 + 76 + 50 = 360) and scores M0A0. 'The Beech sector should be 72°' scores M1A0 unless the reason (not a multiple of 9° or not a whole number of trees) is given. Do not accept 'the sectors are the wrong size', 'there is no title' or 'there is no key' with no reason (M0A0). Ignore any non-contradictory or irrelevant statements.

Question 3

3 marks

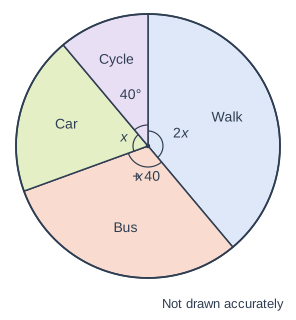
The pie chart shows how 180 students travel to school.

Work out the number of students who travel by bus.

Pie chart. A circle divided into sectors, drawn clockwise from the top (12 o'clock): Walk, with its angle marked 2x; Bus, with its angle marked x + 40; Car, with its angle marked x; Cycle, 40° (printed). Each printed angle is marked with a small arc at the centre. It is marked "Not drawn accurately".

Model answer

\(2x + (x + 40) + x + 40 = 360\)
\(4x + 80 = 360\)
\(x = 70\)
Bus angle \(= 70 + 40 = 110^\circ\)
Number who travel by bus \(= \dfrac{110}{360} \times 180 = 55\)

Explanation

The angles in a pie chart add up to 360°, so form and solve an equation for x. Then find the bus angle and turn it into a number of students: with 180 students each student is 2°, so 110° is 55 students. Common errors are leaving out the 40° sector and giving the angle instead of the number of students.

Mark scheme
  1. 1 mark

    M1 for \(2x + x + 40 + x + 40 = 360\)

    oe, eg \(4x + 80 = 360\) or \(4x = 280\)

  2. 1 mark

    A1 for \(x = 70\) or bus angle 110°

    Implied by a correct final answer.

  3. 1 mark

    A1 for 55

    \(\dfrac{110}{360} \times 180\). Correct answer with no working scores 3 marks. 110 (the bus angle) as the final answer scores M1A1A0. \(x = 80\) (from leaving out the 40° cycle sector) leads to 60: M0A0A0.

Question 4

4 marks

A florist recorded the type of flowers bought by each customer in May.
The results are shown in a pie chart with a radius of 5 cm.
In this pie chart, the sector for roses has an angle of 72° and represents 30 customers.

In June, 200 customers bought flowers.
The florist will show the results for June in a comparative pie chart.

Work out the radius of the pie chart for June.
Give your answer to 1 decimal place.

Model answer

In May, 72° represents 30 customers, so 360° represents \(\dfrac{360}{72} \times 30 = 150\) customers.
The areas of the pie charts are proportional to the numbers of customers:
\(r^2 = 5^2 \times \dfrac{200}{150} = 33.33...\)
\(r = \sqrt{33.33...} = 5.773...\)

Answer: 5.8 cm (to 1 decimal place)

Explanation

First use the roses sector to find how many customers the May pie chart represents: 72° is one fifth of 360°, so there were 5 × 30 = 150 customers. Then multiply the radius by the square root of (June total ÷ May total), because the areas must be in proportion to the totals. Leaving out the square root (6.7 cm) and using 30 as the May total are common errors.

Mark scheme
  1. 1 mark

    M1 for \(\dfrac{30}{72} \times 360\) or \(\dfrac{360}{72} \times 30\)

    oe, eg 1 customer is \(72 \div 30 = 2.4^\circ\), so \(360 \div 2.4\)

  2. 1 mark

    A1 for 150 (customers in May)

    May be implied by a correct radius or by \(\dfrac{200}{150}\) seen.

  3. 1 mark

    M1 for \(5 \times \sqrt{\dfrac{200}{\text{their } 150}}\) or \(r^2 = 5^2 \times \dfrac{200}{\text{their } 150}\)

    oe, eg \(\sqrt{\dfrac{100}{3}}\), \(\pi r^2 = \pi \times 25 \times \dfrac{4}{3}\). ft their total for May, which must come from a method using 30 and 72. \(5 \times \dfrac{200}{150}\) (no square root, = 6.7) scores M0A0 for these two marks. Using 30 as the total for May (\(5\sqrt{\dfrac{200}{30}} = 12.9\)) scores M0A0M0A0.

  4. 1 mark

    A1 for 5.8 (cm)

    Accept 5.8, or more accurate values in [5.77, 5.78] (the exact value is 5.7735...). 5.7 (truncated) scores A0. Correct answer with no working scores 4 marks.

Ready to try the rest? Every answer you write is marked against the mark scheme, so you can see exactly where the marks are.

Study Helper Hints first, answers after you try

Stuck on this one? Ask for a hint and I’ll point you in the right direction, without giving the answer away. Once you’ve checked your answer, I’ll show you how the marks are awarded.