Level:
Correct: 0
Incorrect: 0
Marks: 0/0
Exam Practice
Course:
Topics:
AQA GCSE Statistics (Higher Paper 1) Smart practice A mixed round aimed at your weak spots
Unit 1
Planning and collecting data
Unit 2
Representing data
Section C: C1a (tabulation, tally, pictogram); Section E: E3d
Tabulation, tallies, pictograms and tables of data
Section C: C1a (pie chart), C1b (comparative pie chart)
Pie charts and comparative pie charts
Section C: C1a (stem and leaf diagram)
Stem and leaf diagrams
Section C: C2 (bar charts, bar line charts, line charts, frequency polygons)
Bar charts, line charts and frequency polygons
Section C: C2 (cumulative frequency charts)
Cumulative frequency diagrams
Section C: C2 (histograms), C3b
Histograms and frequency density
Section C: C2 (box plots); Section D: D3b; Section E: E5b
Box plots and outliers
Unit 3
Summarising data
Section D: D1a (mode, median, arithmetic mean)
Mode, median and mean
Section D: D1a (weighted mean, geometric mean), D1b
Weighted mean, geometric mean and choosing an average
Section D: D2; Section E: E5a
Skewness
Section D: D3a (range, quartiles, IQR, percentiles, interpercentile and interdecile range)
Range, quartiles, percentiles and interdecile range
Section D: D3a (standard deviation)
Standard deviation
Section C: C2 (time series); Section D: D1a (mean seasonal variation), D4; Section E: E6
Time series, moving averages and seasonal variation
Section C: C2 (scatter charts); Section D: D5
Scatter diagrams, lines of best fit and regression lines
Section D: D6; Section E: E9a, E9b, E9c
Spearman's rank correlation coefficient
Unit 4
Probability
Unit 5
Interpreting and evaluating results
Unit 6
Statistical enquiry cycle
3.6 Statistical enquiry cycle: 3.6.1 Initial planning, 3.6.2 Data collection
Statistical enquiry cycle: planning and data collection
3.6 Statistical enquiry cycle: 3.6.3 Processing and presentation, 3.6.4 Interpretation, 3.6.5 Evaluation
Statistical enquiry cycle: analysis and evaluation
Avg
score:
–
Topics
done:
0/39

Time series, moving averages and seasonal variation

Practise 19 exam-style questions on Time series, moving averages and seasonal variation for AQA GCSE Statistics (Higher Paper 1). Write your answer as you would in the exam and get it marked in seconds against the mark scheme, point by point, with the Study Helper on hand if you get stuck.

  • 19 questions
  • 1–5 marks each
  • Instant marking
  • No sign-up needed
19 questions, marked as you go

Sample questions with model answers

Here are 4 of the questions in this topic, each with a model answer, an explanation of why it earns the marks and the mark scheme an examiner would use.

Question 1

1 mark

A cinema manager worked out the 4-point moving averages for the number of tickets sold each quarter.

In time order, the moving averages, in thousands of tickets, are

18.4   18.1   17.7   17.6   17.2   16.9   16.5

Describe the trend in the number of tickets sold.

Model answer

The moving averages fall steadily from 18.4 thousand to 16.5 thousand, so the number of tickets the cinema sells is decreasing over time.

Explanation

Moving averages smooth out the seasonal variation, so their direction shows the trend. Here every moving average is lower than the one before, so ticket sales are falling. The description must be in context: saying only 'decreasing', or describing the moving averages without saying what they measure, does not earn the mark.

Mark scheme
  1. 1 mark

    B1 for the number of tickets sold is decreasing (over time)

    oe, eg 'ticket sales are going down', 'the cinema is selling fewer tickets as time goes on'. Must be in context (tickets / ticket sales). 'Decreasing' or 'a downward trend' alone B0. 'The moving averages decrease' with no context B0. 'Ticket sales are falling steadily' or 'gradually' is accepted (B1), but 'falling at a constant rate' or 'by the same amount each quarter' B0 (the decreases are not equal). Reference to correlation B0. A comment about only two of the values, eg 'it fell from 17.7 to 17.6', B0. Accept a correct statement with values, eg 'sales fell from an average of about 18 400 to 16 500 tickets a quarter'.
Question 2

2 marks

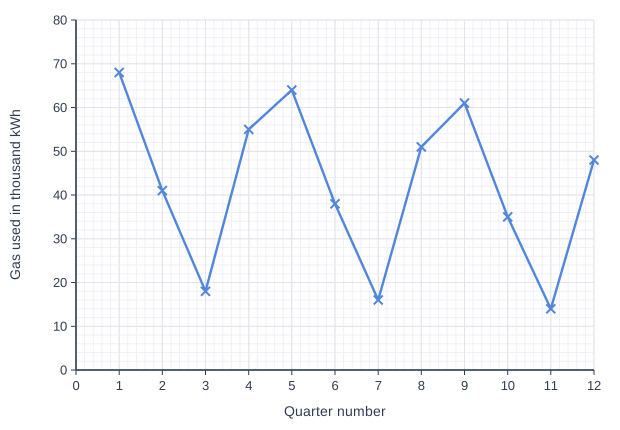
A school recorded the amount of gas it used each quarter from 2022 to 2024.
The time series graph shows the data. Quarter number 1 is January to March 2022 (2022 Q1), quarter number 2 is 2022 Q2, and so on.

Make one comment about the trend and one comment about the seasonal variation shown by the graph.
Give your answers in context.

Line graph of gas used in thousand kWh (y-axis, 0 to 80) against quarter number (x-axis, 0 to 12). The line joins the points (1, 68), (2, 41), (3, 18), (4, 55), (5, 64), (6, 38), (7, 16), (8, 51), (9, 61), (10, 35), (11, 14), (12, 48).

Model answer

Trend: the amount of gas the school uses is decreasing over time (the Quarter 1 values fall from 68 to 64 to 61 thousand kWh).

Seasonal variation: each year the school uses the most gas in Quarter 1 (January to March) and the least in Quarter 3 (July to September).

Explanation

The trend is the general direction of the data over the whole time period, ignoring the ups and downs within each year. The seasonal variation is the pattern that repeats every year, here high gas use in the winter quarter and low use in the summer quarter. Both comments must say what is being measured.

Mark scheme
  1. 1 mark

    B1 for trend: the amount of gas the school uses is decreasing over time

    oe, eg 'gas use is going down each year'. Must be in context (gas / gas use). 'Decreasing' alone B0. A comparison of two adjacent quarters only B0. Reference to correlation B0. Ignore any non-contradictory or irrelevant statements.

  2. 1 mark

    B1 for seasonal variation: the school uses the most gas in Quarter 1 (January to March) / the least gas in Quarter 3 (July to September) each year

    oe. Either the highest or the lowest quarter is enough. Accept 'more gas is used in the winter than in the summer'. 'There are peaks and troughs' or 'it goes up and down' with no detail B0. Must refer to gas or gas use.

Question 3

2 marks

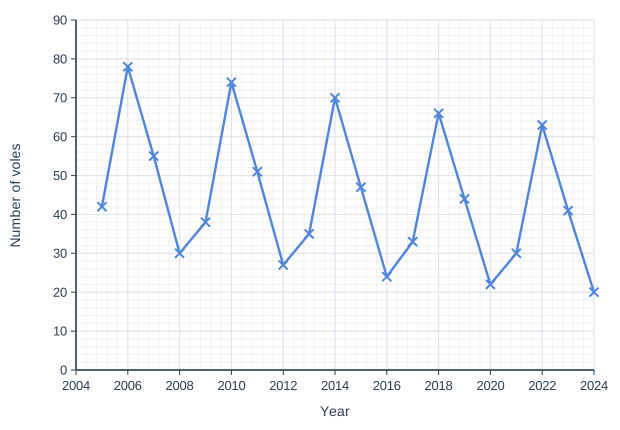
A wildlife group counted the number of voles in a nature reserve each year from 2005 to 2024.
The graph shows the results.

Describe the cyclic pattern in the number of voles.

State, with a reason, how many points you would use in moving averages to find the trend in these data.

Line graph of number of voles (y-axis, 0 to 90) against year (x-axis, 2004 to 2024). The line joins the points (2005, 42), (2006, 78), (2007, 55), (2008, 30), (2009, 38), (2010, 74), (2011, 51), (2012, 27), (2013, 35), (2014, 70), (2015, 47), (2016, 24), (2017, 33), (2018, 66), (2019, 44), (2020, 22), (2021, 30), (2022, 63), (2023, 41), (2024, 20).

Model answer

The number of voles rises and falls in a cycle that repeats every 4 years: there are peaks in 2006, 2010, 2014, 2018 and 2022 (and the peaks are slowly getting lower).

I would use 4-point moving averages, because the cycle is 4 years long, so each moving average covers one whole cycle.

Explanation

A cyclic pattern repeats over a number of years rather than within a year. Describe it by its length (peak to peak) in context. To find the trend, the order of the moving average should equal the length of one cycle, here 4 years; the reason is not 'four seasons', because these are yearly data.

Mark scheme
  1. 1 mark

    B1 for the number of voles reaches a peak every 4 years (2006, 2010, 2014, 2018, 2022) / rises and falls in a 4-year cycle

    oe. Must give the length of the cycle (4 years) or the years of the peaks or of the lows (2008, 2012, 2016, 2020, 2024). 'The peaks are getting lower' on its own B0 (it describes the trend, not the cycle). 'There are peaks and troughs' or 'it goes up and down' B0.

  2. 1 mark

    B1 for 4-point moving averages, because the pattern repeats every 4 years

    oe. The reason is needed: '4-point' alone B0. ft their cycle length from the first mark if it is clearly stated. 12-point (monthly) or 4-point 'because there are 4 seasons/quarters' B0.

Question 4

4 marks

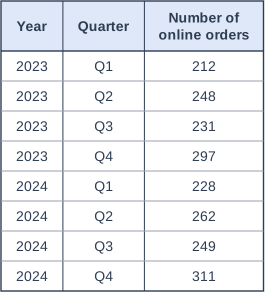
A bakery recorded the number of online orders it received each quarter in 2023 and 2024.
The table shows the data.

Work out all the 4-point moving averages for these data.

Describe the trend in the number of online orders.

Table with columns "Year", "Quarter", "Number of online orders". Year: 2023; Quarter: Q1; Number of online orders: 212 | Year: 2023; Quarter: Q2; Number of online orders: 248 | Year: 2023; Quarter: Q3; Number of online orders: 231 | Year: 2023; Quarter: Q4; Number of online orders: 297 | Year: 2024; Quarter: Q1; Number of online orders: 228 | Year: 2024; Quarter: Q2; Number of online orders: 262 | Year: 2024; Quarter: Q3; Number of online orders: 249 | Year: 2024; Quarter: Q4; Number of online orders: 311.

Model answer

\((212 + 248 + 231 + 297) \div 4 = 988 \div 4 = 247\)
\((248 + 231 + 297 + 228) \div 4 = 1004 \div 4 = 251\)
\((231 + 297 + 228 + 262) \div 4 = 1018 \div 4 = 254.5\)
\((297 + 228 + 262 + 249) \div 4 = 1036 \div 4 = 259\)
\((228 + 262 + 249 + 311) \div 4 = 1050 \div 4 = 262.5\)

The moving averages rise from 247 to 262.5, so the number of online orders is increasing over time.

Explanation

Each 4-point moving average is the mean of four consecutive quarters; move on one quarter at a time, so 8 quarters give 5 moving averages. Because each one covers a whole year, the seasonal variation is smoothed out and the moving averages show the trend. The trend description needs context, not just 'increasing'.

Mark scheme
  1. 1 mark

    M1 for a correct method for one 4-point moving average, eg \((212 + 248 + 231 + 297) \div 4\)

    Implied by any one correct moving average.

  2. 1 mark

    A1 for at least three correct moving averages from 247, 251, 254.5, 259, 262.5

    Condone 255 for 254.5 and 263 for 262.5.

  3. 1 mark

    A1 for all five correct: 247, 251, 254.5, 259, 262.5

    With no incorrect extra values (eg 3-point averages or a sixth value). Condone 255 for 254.5 and 263 for 262.5.

  4. 1 mark

    B1 for the number of online orders is increasing (over time)

    oe, eg 'the bakery is getting more online orders as time goes on'. ft their moving averages if they increase. Must be in context (orders). 'Increasing' alone B0. 'Positive correlation' B0. A comparison of two single quarters, eg '2024 Q4 is higher than 2024 Q3', B0. Ignore any non-contradictory or irrelevant statements.

Ready to try the rest? Every answer you write is marked against the mark scheme, so you can see exactly where the marks are.

Study Helper Hints first, answers after you try

Stuck on this one? Ask for a hint and I’ll point you in the right direction, without giving the answer away. Once you’ve checked your answer, I’ll show you how the marks are awarded.