Level:
Correct: 0
Incorrect: 0
Marks: 0/0
Exam Practice
Course:
Topics:
AQA GCSE Statistics (Higher Paper 1) Smart practice A mixed round aimed at your weak spots
Unit 1
Planning and collecting data
Unit 2
Representing data
Section C: C1a (tabulation, tally, pictogram); Section E: E3d
Tabulation, tallies, pictograms and tables of data
Section C: C1a (pie chart), C1b (comparative pie chart)
Pie charts and comparative pie charts
Section C: C1a (stem and leaf diagram)
Stem and leaf diagrams
Section C: C2 (bar charts, bar line charts, line charts, frequency polygons)
Bar charts, line charts and frequency polygons
Section C: C2 (cumulative frequency charts)
Cumulative frequency diagrams
Section C: C2 (histograms), C3b
Histograms and frequency density
Section C: C2 (box plots); Section D: D3b; Section E: E5b
Box plots and outliers
Unit 3
Summarising data
Section D: D1a (mode, median, arithmetic mean)
Mode, median and mean
Section D: D1a (weighted mean, geometric mean), D1b
Weighted mean, geometric mean and choosing an average
Section D: D2; Section E: E5a
Skewness
Section D: D3a (range, quartiles, IQR, percentiles, interpercentile and interdecile range)
Range, quartiles, percentiles and interdecile range
Section D: D3a (standard deviation)
Standard deviation
Section C: C2 (time series); Section D: D1a (mean seasonal variation), D4; Section E: E6
Time series, moving averages and seasonal variation
Section C: C2 (scatter charts); Section D: D5
Scatter diagrams, lines of best fit and regression lines
Section D: D6; Section E: E9a, E9b, E9c
Spearman's rank correlation coefficient
Unit 4
Probability
Unit 5
Interpreting and evaluating results
Unit 6
Statistical enquiry cycle
3.6 Statistical enquiry cycle: 3.6.1 Initial planning, 3.6.2 Data collection
Statistical enquiry cycle: planning and data collection
3.6 Statistical enquiry cycle: 3.6.3 Processing and presentation, 3.6.4 Interpretation, 3.6.5 Evaluation
Statistical enquiry cycle: analysis and evaluation
Avg
score:
–
Topics
done:
0/39

Stem and leaf diagrams

Practise 14 exam-style questions on Stem and leaf diagrams for AQA GCSE Statistics (Higher Paper 1). Write your answer as you would in the exam and get it marked in seconds against the mark scheme, point by point, with the Study Helper on hand if you get stuck.

  • 14 questions
  • 1–6 marks each
  • Instant marking
  • No sign-up needed
14 questions, marked as you go

Sample questions with model answers

Here are 4 of the questions in this topic, each with a model answer, an explanation of why it earns the marks and the mark scheme an examiner would use.

Question 1

1 mark

The back-to-back stem and leaf diagram shows the number of press-ups done in one minute by some students in Year 10 and Year 11.

Work out the median number of press-ups for Year 10.
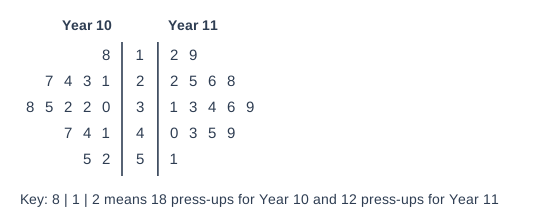
Back-to-back stem and leaf diagram. Key: 8 | 1 | 2 means 18 press-ups for Year 10 and 12 press-ups for Year 11. The stems are in the middle column; "Year 10" leaves are on the left, read outwards from the stem (smallest next to the stem), and "Year 11" leaves are on the right. Rows (Year 10 leaves | stem | Year 11 leaves): 8 | 1 | 2 9; 1 3 4 7 | 2 | 2 5 6 8; 0 2 2 5 8 | 3 | 1 3 4 6 9; 1 4 7 | 4 | 0 3 5 9; 2 5 | 5 | 1.

Model answer

Year 10 has 15 students, so the median is the \(\dfrac{15 + 1}{2} = 8\)th value.
Year 10 in order: 18, 21, 23, 24, 27, 30, 32, 32, ...

Median = 32 press-ups

Explanation

On a back-to-back diagram the left-hand leaves belong with the stem in the middle, so a left leaf of 2 next to the stem 3 means 32 (as the key shows). Count the Year 10 values only, from the smallest, to the 8th value. Students often misread the left side or count both year groups together.

Mark scheme
  1. 1 mark

    B1 for 32

    There are 15 Year 10 students, so the median is the 8th value (the 7th and 8th values are both 32). The Year 10 leaves are on the left and are read outwards from the stem. 23 or 33 (misreading the left-hand leaves, eg reading 2 | 3 as 23 when it means 32) scores B0. 33.5 is the median for Year 11: B0.
Question 2

2 marks

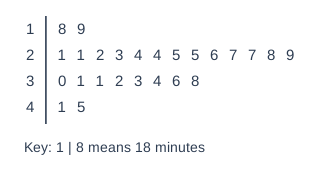
The stem and leaf diagram shows the times, in minutes, of 25 runners in a 5 km race.

What percentage of the runners took less than 25 minutes?

Stem and leaf diagram. Key: 1 | 8 means 18 minutes. Rows (stem | leaves): 1 | 8 9; 2 | 1 1 2 3 4 4 5 5 6 7 7 8 9; 3 | 0 1 1 2 3 4 6 8; 4 | 1 5.

Model answer

Runners with times less than 25 minutes: 18, 19, 21, 21, 22, 23, 24, 24, so 8 runners.
Percentage \(= \dfrac{8}{25} \times 100 = 32\%\)

Explanation

Count the values below 25: all of the 1 stem and the leaves 1 to 4 on the 2 stem. The two runners who took exactly 25 minutes did not take less than 25 minutes, so they are not included. Then write the count as a percentage of all 25 runners.

Mark scheme
  1. 1 mark

    M1 for \(\dfrac{8}{25}\) (\(\times 100\)) or 8 runners

    oe

  2. 1 mark

    A1 for 32(%)

    Correct answer with no working scores 2 marks. SC1 for 40(%) (the two runners who took exactly 25 minutes have been included). 68% (those taking 25 minutes or more) scores M0A0.

Question 3

3 marks

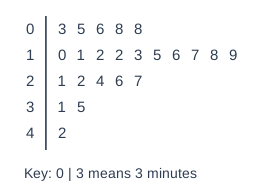
The stem and leaf diagram shows the times, in minutes, that 23 patients waited to see a doctor.

Work out the median and the interquartile range of the waiting times.

Stem and leaf diagram. Key: 0 | 3 means 3 minutes. Rows (stem | leaves): 0 | 3 5 6 8 8; 1 | 0 1 2 2 3 5 6 7 8 9; 2 | 1 2 4 6 7; 3 | 1 5; 4 | 2.

Model answer

n = 23
Median: \(\dfrac{23 + 1}{2} = 12\)th value = 16 minutes
Lower quartile: \(\dfrac{23 + 1}{4} = 6\)th value = 10 minutes
Upper quartile: \(\dfrac{3(23 + 1)}{4} = 18\)th value = 24 minutes
Interquartile range \(= 24 - 10 = 14\) minutes

Explanation

With 23 values, the lower quartile, median and upper quartile are the 6th, 12th and 18th values. Count carefully along each row, and remember that the IQR is the upper quartile minus the lower quartile, not the largest value minus the smallest.

Mark scheme
  1. 1 mark

    B1 for median 16 (minutes)

    The 12th value.

  2. 1 mark

    M1 for lower quartile 10 or upper quartile 24

    The 6th and 18th values. Either correct quartile, or 24 - 10, scores M1.

  3. 1 mark

    A1 for interquartile range 14 (minutes)

    Correct answers with no working score full marks. The range (42 - 3 = 39) instead of the IQR scores M0A0.

Question 4

5 marks

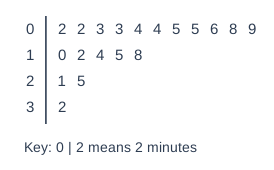
A station manager recorded the delays, in minutes, of 19 trains arriving at the station one morning.
The stem and leaf diagram shows the results.

For all trains in the country that morning, the median delay was 6 minutes and the interquartile range was 9 minutes.

Compare the delays of the trains at the station with the delays of all trains in the country.

Stem and leaf diagram. Key: 0 | 2 means 2 minutes. Rows (stem | leaves): 0 | 2 2 3 3 4 4 5 5 6 8 9; 1 | 0 2 4 5 8; 2 | 1 5; 3 | 2.

Model answer

Station: median = 10th value = 8 minutes
Lower quartile = 5th value = 4 minutes, upper quartile = 15th value = 15 minutes
Interquartile range \(= 15 - 4 = 11\) minutes

On average, trains at the station were delayed for longer than trains in the whole country (median 8 minutes compared with 6 minutes).
The delays at the station were more varied than for all trains (IQR 11 minutes compared with 9 minutes).

Explanation

To compare a sample with population figures, work out the same measures for the sample (median and IQR) and compare each one in context. The comparisons must say what the values mean for the delays, not just that one number is bigger. Note that a higher delay is worse, so take care with words like 'better'.

Mark scheme
  1. 1 mark

    B1 for median 8 (minutes)

    The 10th value.

  2. 1 mark

    M1 for lower quartile 4 or upper quartile 15

    The 5th and 15th values.

  3. 1 mark

    A1 for interquartile range 11 (minutes)

    The range (32 - 2 = 30) instead of the IQR scores M0A0.

  4. 1 mark

    B1ft for a correct comparison of the averages in context, eg trains at the station were delayed for longer on average than trains in the whole country

    ft their median compared with 6. oe, eg 'trains at this station were generally later'. 'The station median is higher' (no interpretation) scores B0. 'The station is worse' with no reference to delays or to the average scores B0.

  5. 1 mark

    B1ft for a correct comparison of the spreads in context, eg the delays at the station varied more (were less consistent) than for all trains

    ft their IQR compared with 9. 'The IQR is larger' (no interpretation) scores B0. Comparing the range of the station delays (30) with the IQR of 9 scores B0. Any values stated must be correct. Ignore any non-contradictory or irrelevant statements.

Ready to try the rest? Every answer you write is marked against the mark scheme, so you can see exactly where the marks are.

Study Helper Hints first, answers after you try

Stuck on this one? Ask for a hint and I’ll point you in the right direction, without giving the answer away. Once you’ve checked your answer, I’ll show you how the marks are awarded.