
Level:
Correct: 0
Incorrect: 0
Marks: 0/0
Exam Practice
Course:
Topics:
AQA GCSE Statistics (Higher Paper 1) Smart practice A mixed round aimed at your weak spots
Unit 1
Planning and collecting data
Unit 2
Representing data
Section C: C1a (tabulation, tally, pictogram); Section E: E3d
Tabulation, tallies, pictograms and tables of data
Section C: C1a (pie chart), C1b (comparative pie chart)
Pie charts and comparative pie charts
Section C: C1a (stem and leaf diagram)
Stem and leaf diagrams
Section C: C2 (bar charts, bar line charts, line charts, frequency polygons)
Bar charts, line charts and frequency polygons
Section C: C2 (cumulative frequency charts)
Cumulative frequency diagrams
Section C: C2 (histograms), C3b
Histograms and frequency density
Section C: C2 (box plots); Section D: D3b; Section E: E5b
Box plots and outliers
Unit 3
Summarising data
Section D: D1a (mode, median, arithmetic mean)
Mode, median and mean
Section D: D1a (weighted mean, geometric mean), D1b
Weighted mean, geometric mean and choosing an average
Section D: D2; Section E: E5a
Skewness
Section D: D3a (range, quartiles, IQR, percentiles, interpercentile and interdecile range)
Range, quartiles, percentiles and interdecile range
Section D: D3a (standard deviation)
Standard deviation
Section C: C2 (time series); Section D: D1a (mean seasonal variation), D4; Section E: E6
Time series, moving averages and seasonal variation
Section C: C2 (scatter charts); Section D: D5
Scatter diagrams, lines of best fit and regression lines
Section D: D6; Section E: E9a, E9b, E9c
Spearman's rank correlation coefficient
Unit 4
Probability
Unit 5
Interpreting and evaluating results
Unit 6
Statistical enquiry cycle
3.6 Statistical enquiry cycle: 3.6.1 Initial planning, 3.6.2 Data collection
Statistical enquiry cycle: planning and data collection
3.6 Statistical enquiry cycle: 3.6.3 Processing and presentation, 3.6.4 Interpretation, 3.6.5 Evaluation
Statistical enquiry cycle: analysis and evaluation
Avg
score:
–
Topics
done:
0/39

Correlation, causation and association

Practise 16 exam-style questions on Correlation, causation and association for AQA GCSE Statistics (Higher Paper 1). Write your answer as you would in the exam and get it marked in seconds against the mark scheme, point by point, with the Study Helper on hand if you get stuck.

  • 16 questions
  • 1–5 marks each
  • Instant marking
  • No sign-up needed
16 questions, marked as you go

Sample questions with model answers

Here are 4 of the questions in this topic, each with a model answer, an explanation of why it earns the marks and the mark scheme an examiner would use.

Question 1

1 mark

A correlation coefficient has the value \(-0.6\)

Which of these describes this correlation?

Choose your answer.

  • strong positive
  • weak negative
  • strong negative
  • no correlation

Model answer

Strong negative

Explanation

Correlation coefficients of 0.6 or above, or \(-0.6\) or below, are described as strong; values from 0.2 up to (but not including) 0.6, or from \(-0.2\) down to (but not including) \(-0.6\), are weak; values strictly between \(-0.2\) and 0.2 show no correlation. So \(-0.6\) is on the boundary and counts as strong negative. A common error is to call it weak.

Mark scheme
  1. 1 mark

    B1 for strong negative

    Any other answer, or more than one answer, scores B0. The specification (E8b) describes values of \(-0.6\) or below as strong, so \(-0.6\) itself is strong. 'Weak negative' is the most likely wrong answer.
Question 2

2 marks

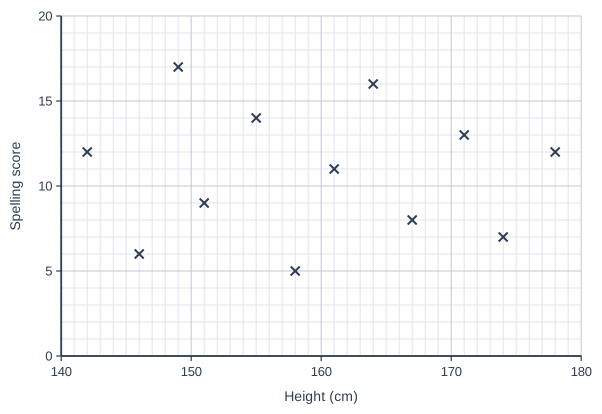
Ali recorded the height and the score in a spelling test of 12 students.
The scatter graph shows his results.

Ali says,
"Taller students are better at spelling."

Describe the correlation shown by the scatter graph.
Does the scatter graph support Ali's statement? Give a reason for your answer.

Scatter graph on a grid of small squares. The horizontal axis is "Height (cm)", from 140 to 180, numbered every 10, with 10 small squares between numbered values (each small square is 1). The vertical axis is "Spelling score", from 0 to 20, numbered every 5, with 5 small squares between numbered values (each small square is 1). 12 points are plotted as crosses: (142, 12), (146, 6), (149, 17), (151, 9), (155, 14), (158, 5), (161, 11), (164, 16), (167, 8), (171, 13), (174, 7) and (178, 12).

Model answer

There is no correlation between height and spelling score.
No, the graph does not support Ali: taller students did not tend to get higher spelling scores - the points are scattered with no pattern.

Explanation

When the points show no upward or downward pattern, there is no correlation, so one variable tells you nothing about the other. Ali's statement would need a positive correlation (taller students tending to score more). Describing a random scatter as weak correlation is a common error.

Mark scheme
  1. 1 mark

    B1 for no correlation

    oe. Accept 'zero correlation' or 'no relationship'. Do not accept 'weak correlation', 'weak positive' or 'weak negative'.

  2. 1 mark

    B1 for No, with a correct reason, eg taller students do not tend to get higher spelling scores / there is no relationship between height and spelling score

    oe. 'No, because there is no correlation' is acceptable. 'No' with no reason scores B0. Do not accept 'No, because height does not cause good spelling' on its own (the graph shows no correlation, which is the reason). Ignore any non-contradictory or irrelevant statements.

Question 3

3 marks

A police community officer recorded the number of street lights and the number of burglaries last year in 15 streets of similar length in a town.
The correlation coefficient between the number of street lights and the number of burglaries is \(-0.72\)

The officer says,
"More street lights cause fewer burglaries. If we double the number of street lights in every street, there will be far fewer burglaries next year."

Give three reasons why the officer's conclusion may not be correct.

Model answer

1. Correlation does not imply causation: a correlation of -0.72 does not prove that the street lights cause there to be fewer burglaries.
2. Other factors such as how busy the street is, CCTV or police patrols also affect the number of burglaries, and they may be linked to the lighting: busy streets may have more lights and more people about to see a burglar.
3. Doubling the number of street lights takes the values outside the range of the data. This is extrapolation and the pattern may not continue - once a street is well lit, more lights may make little difference.

Explanation

A strong negative correlation shows an association, but the number of burglaries depends on many factors that act together, so the lighting alone may not explain the pattern. Predicting what happens with double the number of lights goes beyond the data, so it is extrapolation. Each reason must be a different idea: listing two kinds of security, such as CCTV and police patrols, counts as one reason.

Mark scheme
  1. 3 marks

    B3 for three different reasons from:
    correlation does not imply causation (it does not prove that the street lights cause there to be fewer burglaries)
    other factors also affect the number of burglaries, eg the number of houses in the street, how busy the street is, CCTV, police patrols, neighbourhood watch schemes (and they may interact with the lighting)
    doubling the number of street lights is outside the range of the data (extrapolation), so the pattern may not continue / once a street is well lit, more lights may make little difference
    the data are for one year (and 15 streets) only, so next year may be different / the 15 streets may not be representative of all the streets in the town

    1 mark for each different reason, max 3 (B2 for two different reasons, B1 for one). Several named factors in the same category (eg 'CCTV and police patrols') count as one reason. Accept 'the correlation of -0.72 is not perfect, so the number of burglaries does not depend only on the street lights' as the 'other factors' reason if no other factor is named. Do not accept 'the correlation is weak' (-0.72 is strong) or 'the correlation is negative, so more lights mean more burglaries' - do not award a mark for a statement that contradicts the data. Ignore any non-contradictory or irrelevant statements.

Question 4

4 marks

A school runs a homework club after school.
For a sample of 60 Year 9 students, a teacher compared the number of hours each student spent at the homework club during one term with their end-of-term test mark.
The correlation coefficient is \(-0.45\)

The headteacher says,
"The homework club is making students do worse in their tests. We should close it."

Interpret the correlation coefficient in context, including the strength and direction of the correlation, and evaluate the headteacher's statement.

Model answer

\(-0.45\) shows a weak negative correlation: students who spent more hours at the homework club tended to get lower test marks.
This does not show that the club causes lower marks - correlation does not imply causation.
It is more likely that students who find the subject difficult, or who already had low marks, are the ones who go to (or are sent to) the homework club. So the low marks may be the reason for going to the club, not the result of it, and closing the club may not improve marks.

Explanation

Describe the correlation using the strength bands, then interpret it in context with 'tended to'. A correlation can arise because the 'effect' actually causes the 'cause' (struggling students attend the club), or because a third variable such as previous attainment affects both. The headteacher's conclusion assumes a cause that the data cannot show.

Mark scheme
  1. 1 mark

    B1 for weak negative correlation

    The question asks for the strength, so both strength and direction are needed: on the specification bands (SPEC E8b) \(-0.45\) is weak. 'Moderate' is not one of the bands and is not credited: 'strong negative' or 'moderate negative' scores B0.

  2. 1 mark

    B1 for interpretation in context, eg students who spent more hours at homework club tended to get lower test marks

    oe. Must refer to both time at homework club and test marks.

  3. 1 mark

    B1 for correlation does not imply causation, eg it does not prove the club causes lower marks

    oe

  4. 1 mark

    B1 for a valid alternative explanation, eg students who find the work hard (or have lower ability or lower previous marks) are more likely to go to the club / are sent to the club

    oe. Accept any explanation where low attainment leads to attending the club, or a named third variable that affects both (eg previous attainment, confidence, support at home). Do not accept 'other factors' with no example. Ignore any non-contradictory or irrelevant statements.

Ready to try the rest? Every answer you write is marked against the mark scheme, so you can see exactly where the marks are.

Study Helper Hints first, answers after you try

Stuck on this one? Ask for a hint and I’ll point you in the right direction, without giving the answer away. Once you’ve checked your answer, I’ll show you how the marks are awarded.