
Level:
Correct: 0
Incorrect: 0
Marks: 0/0
Exam Practice
Course:
Topics:
AQA GCSE Statistics (Higher Paper 1) Smart practice A mixed round aimed at your weak spots
Unit 1
Planning and collecting data
Unit 2
Representing data
Section C: C1a (tabulation, tally, pictogram); Section E: E3d
Tabulation, tallies, pictograms and tables of data
Section C: C1a (pie chart), C1b (comparative pie chart)
Pie charts and comparative pie charts
Section C: C1a (stem and leaf diagram)
Stem and leaf diagrams
Section C: C2 (bar charts, bar line charts, line charts, frequency polygons)
Bar charts, line charts and frequency polygons
Section C: C2 (cumulative frequency charts)
Cumulative frequency diagrams
Section C: C2 (histograms), C3b
Histograms and frequency density
Section C: C2 (box plots); Section D: D3b; Section E: E5b
Box plots and outliers
Unit 3
Summarising data
Section D: D1a (mode, median, arithmetic mean)
Mode, median and mean
Section D: D1a (weighted mean, geometric mean), D1b
Weighted mean, geometric mean and choosing an average
Section D: D2; Section E: E5a
Skewness
Section D: D3a (range, quartiles, IQR, percentiles, interpercentile and interdecile range)
Range, quartiles, percentiles and interdecile range
Section D: D3a (standard deviation)
Standard deviation
Section C: C2 (time series); Section D: D1a (mean seasonal variation), D4; Section E: E6
Time series, moving averages and seasonal variation
Section C: C2 (scatter charts); Section D: D5
Scatter diagrams, lines of best fit and regression lines
Section D: D6; Section E: E9a, E9b, E9c
Spearman's rank correlation coefficient
Unit 4
Probability
Unit 5
Interpreting and evaluating results
Unit 6
Statistical enquiry cycle
3.6 Statistical enquiry cycle: 3.6.1 Initial planning, 3.6.2 Data collection
Statistical enquiry cycle: planning and data collection
3.6 Statistical enquiry cycle: 3.6.3 Processing and presentation, 3.6.4 Interpretation, 3.6.5 Evaluation
Statistical enquiry cycle: analysis and evaluation
Avg
score:
–
Topics
done:
0/39

Box plots and outliers

Practise 19 exam-style questions on Box plots and outliers for AQA GCSE Statistics (Higher Paper 1). Write your answer as you would in the exam and get it marked in seconds against the mark scheme, point by point, with the Study Helper on hand if you get stuck.

  • 19 questions
  • 1–6 marks each
  • Instant marking
  • No sign-up needed
19 questions, marked as you go

Sample questions with model answers

Here are 4 of the questions in this topic, each with a model answer, an explanation of why it earns the marks and the mark scheme an examiner would use.

Question 1

1 mark

For a set of data, the lower quartile is 24 and the upper quartile is 32.

Which one of these values would be an outlier?

Choose your answer.

  • 13
  • 20
  • 43
  • 45

Model answer

Interquartile range = 32 - 24 = 8
Lower limit = \(24 - 1.5 \times 8 = 12\)
Upper limit = \(32 + 1.5 \times 8 = 44\)
13 and 20 are above 12, and 43 is below 44, so they are not outliers.
45 > 44, so 45 is an outlier.

Explanation

A value is an outlier if it is more than 1.5 interquartile ranges below the lower quartile or above the upper quartile. A common error is to forget the 1.5, which makes 13 and 43 look like outliers; another is to treat any value outside the box as an outlier.

Mark scheme
  1. 1 mark

    B1 for 45

    Any other answer, or more than one answer, scores B0. The interquartile range is 8, so the limits are \(24 - 1.5 \times 8 = 12\) and \(32 + 1.5 \times 8 = 44\); only 45 is outside them. 13 and 43 come from using 1 × IQR (limits 16 and 40), and 20 from thinking that any value outside the box is an outlier.
Question 2

2 marks

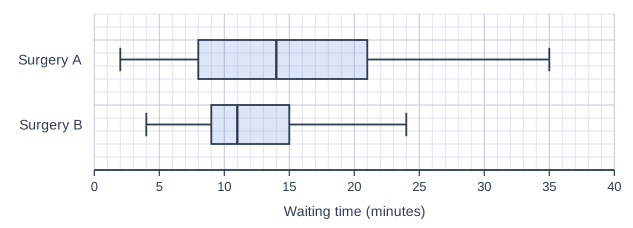
The box plots show the waiting times, in minutes, of patients at two doctors' surgeries, A and B, one morning.

Compare the waiting times at the two surgeries.

2 box plots, one above the other, drawn above a horizontal scale "Waiting time (minutes)" from 0 to 40, numbered every 5, with 5 small squares between numbered values (each small square is 1), on a grid of small squares. "Surgery A" (top): lowest value (left end of the left whisker) 2; lower quartile (left side of the box) 8; median (line inside the box) 14; upper quartile (right side of the box) 21; highest value (right end of the right whisker) 35. "Surgery B" (bottom): lowest value (left end of the left whisker) 4; lower quartile (left side of the box) 9; median (line inside the box) 11; upper quartile (right side of the box) 15; highest value (right end of the right whisker) 24.

Model answer

Surgery A: median 14 minutes, IQR = 21 - 8 = 13 minutes.
Surgery B: median 11 minutes, IQR = 15 - 9 = 6 minutes.
On average, patients waited less time at surgery B, because its median waiting time was lower.
The waiting times at surgery B were more consistent, because its interquartile range was smaller.

Explanation

A full comparison compares an average (the median) and a measure of spread (the interquartile range or range), and says what each means for the patients' waiting times. Stating that one median or IQR is bigger, without saying what that means, does not earn the marks.

Mark scheme
  1. 1 mark

    B1 for a correct comparison of averages in context, eg on average, patients waited less time at surgery B than at surgery A (the median was 11 minutes compared with 14 minutes)

    oe. Must compare, with 'on average', 'generally', 'typically' or an interpretation of the median, eg 'patients at A generally waited longer'. 'The median for B is lower' with no interpretation B0. Quoting the two medians without a comparison B0. Any values stated must be correct.

  2. 1 mark

    B1 for a correct comparison of spread in context, eg the waiting times at surgery B were more consistent / less varied than at surgery A (the IQR was 6 minutes compared with 13 minutes)

    oe. Accept 'waiting times at A were more spread out / varied more'. The interpretation may be based on the interquartile range (A 13, B 6) or the range (A 33, B 20). 'B has a smaller IQR' with no interpretation B0. Context (waiting times / patients) must be seen in at least one of the two comparisons. Ignore any non-contradictory or irrelevant statements.

Question 3

3 marks

Josh asked some students how many hours they spent looking at a screen last week.
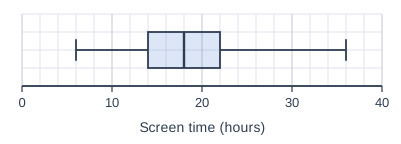
He made this box plot of his results.

Use the box plot to decide whether there are any outliers in Josh's data.
You must show your working.

A box plot drawn above a horizontal scale "Screen time (hours)" from 0 to 40, numbered every 10, with 5 small squares between numbered values (each small square is 2), on a grid of small squares. The box plot: lowest value (left end of the left whisker) can be read from the scale; lower quartile (left side of the box) can be read from the scale; median (line inside the box) can be read from the scale; upper quartile (right side of the box) can be read from the scale; highest value (right end of the right whisker) can be read from the scale.

Model answer

From the box plot: lowest value 6, LQ 14, median 18, UQ 22, highest value 36 (hours).
IQR = 22 - 14 = 8 hours, and \(1.5 \times 8 = 12\)
Lower limit = 14 - 12 = 2 and upper limit = 22 + 12 = 34
The highest value, 36 hours, is greater than 34, so it is an outlier.
The lowest value, 6 hours, is greater than 2, so there are no small outliers.
So there is at least one outlier: the highest value (36 hours), which should not have been joined to the whisker. (Any other values above 34 hours would also be outliers, but the box plot does not show them.)

Explanation

Read the quartiles from the box plot, find 1.5 times the interquartile range, and subtract it from the lower quartile and add it to the upper quartile. Then check both the lowest and the highest values. A box plot drawn with its whisker reaching an outlier is drawn incorrectly: the outlier should be marked on its own.

Mark scheme
  1. 1 mark

    M1 for \(14 - 1.5 \times (22 - 14)\) or \(22 + 1.5 \times (22 - 14)\)

    oe. ft their quartiles read from the box plot (LQ 14, UQ 22). The IQR 8 and \(1.5 \times 8 = 12\) may be seen first.

  2. 1 mark

    A1 for 2 and 34

    ft their quartiles. Both limits are needed.

  3. 1 mark

    A1ft for the highest value, 36, is an outlier (36 > 34) and the lowest value, 6, is not (6 > 2)

    Dep on M1 (not on the previous A1): ft their limits and their readings of the lowest and highest values (6 and 36). Both ends must be considered, eg 'there is an outlier at 36 but no small outliers'. Condone 'there is one outlier, 36' (the box plot cannot show whether any other values lie between 34 and 36). A decision with no working scores 0, as the question says 'You must show your working'. Common error: using 1 × IQR (limits 6 and 30) scores M0A0A0.

Question 4

4 marks

Megan recorded the times, in minutes, that the 63 members of her running club took to run 10 km.

Lower quartile = 42 minutes   Upper quartile = 50 minutes
Mean = 46.4 minutes   Standard deviation = 5.8 minutes

The slowest member took 63 minutes. Megan says,
"The time of 63 minutes is an outlier."

Comment on Megan's statement.
You must show your working.

Model answer

Using the quartiles: IQR = 50 - 42 = 8 minutes
Upper limit = \(50 + 1.5 \times 8 = 62\) minutes
63 > 62, so by this method 63 minutes is an outlier.
Using the mean and standard deviation: upper limit = \(46.4 + 3 \times 5.8 = 63.8\) minutes
63 < 63.8, so by this method 63 minutes is not an outlier.
So Megan's statement is only correct if she uses the 1.5 × IQR method; the two methods give different conclusions.

Explanation

There are two accepted ways to identify outliers: more than 1.5 interquartile ranges beyond a quartile, or more than 3 standard deviations from the mean. They do not always agree, and this value is close to both limits. A strong answer tests both and states that the conclusion depends on the method; a common error is to forget the 1.5 or the 3 in the calculations.

Mark scheme
  1. 1 mark

    M1 for \(50 + 1.5 \times (50 - 42)\) or \(50 + 12\)

    oe. The IQR 8 may be seen first.

  2. 1 mark

    A1 for 62 and 63 is an outlier using the interquartile range method

    The decision for this method must be seen, eg '63 > 62 so it is an outlier'.

  3. 1 mark

    M1 for \(46.4 + 3 \times 5.8\) or \(\dfrac{63 - 46.4}{5.8}\)

    oe

  4. 1 mark

    A1 for 63.8 (or 2.86) and 63 is not an outlier using the mean and standard deviation method, so whether Megan is correct depends on the method used

    Accept [2.86, 2.87] for the number of standard deviations. The decision for this method must be seen, and the final comment must recognise that the two methods disagree (eg 'it is an outlier by one method but not the other'). 'Megan is correct' or 'Megan is wrong' as the only conclusion, after both correct calculations, scores M1A1M1A0. A conclusion with no working scores 0, as the question says 'You must show your working'.

Ready to try the rest? Every answer you write is marked against the mark scheme, so you can see exactly where the marks are.

Study Helper Hints first, answers after you try

Stuck on this one? Ask for a hint and I’ll point you in the right direction, without giving the answer away. Once you’ve checked your answer, I’ll show you how the marks are awarded.