Level:
Correct: 0
Incorrect: 0
Marks: 0/0
Exam Practice
Course:
Topics:
AQA GCSE Statistics (Higher Paper 1) Smart practice A mixed round aimed at your weak spots
Unit 1
Planning and collecting data
Unit 2
Representing data
Section C: C1a (tabulation, tally, pictogram); Section E: E3d
Tabulation, tallies, pictograms and tables of data
Section C: C1a (pie chart), C1b (comparative pie chart)
Pie charts and comparative pie charts
Section C: C1a (stem and leaf diagram)
Stem and leaf diagrams
Section C: C2 (bar charts, bar line charts, line charts, frequency polygons)
Bar charts, line charts and frequency polygons
Section C: C2 (cumulative frequency charts)
Cumulative frequency diagrams
Section C: C2 (histograms), C3b
Histograms and frequency density
Section C: C2 (box plots); Section D: D3b; Section E: E5b
Box plots and outliers
Unit 3
Summarising data
Section D: D1a (mode, median, arithmetic mean)
Mode, median and mean
Section D: D1a (weighted mean, geometric mean), D1b
Weighted mean, geometric mean and choosing an average
Section D: D2; Section E: E5a
Skewness
Section D: D3a (range, quartiles, IQR, percentiles, interpercentile and interdecile range)
Range, quartiles, percentiles and interdecile range
Section D: D3a (standard deviation)
Standard deviation
Section C: C2 (time series); Section D: D1a (mean seasonal variation), D4; Section E: E6
Time series, moving averages and seasonal variation
Section C: C2 (scatter charts); Section D: D5
Scatter diagrams, lines of best fit and regression lines
Section D: D6; Section E: E9a, E9b, E9c
Spearman's rank correlation coefficient
Unit 4
Probability
Unit 5
Interpreting and evaluating results
Unit 6
Statistical enquiry cycle
3.6 Statistical enquiry cycle: 3.6.1 Initial planning, 3.6.2 Data collection
Statistical enquiry cycle: planning and data collection
3.6 Statistical enquiry cycle: 3.6.3 Processing and presentation, 3.6.4 Interpretation, 3.6.5 Evaluation
Statistical enquiry cycle: analysis and evaluation
Avg
score:
–
Topics
done:
0/39

Spearman's rank correlation coefficient

Practise 17 exam-style questions on Spearman's rank correlation coefficient for AQA GCSE Statistics (Higher Paper 1). Write your answer as you would in the exam and get it marked in seconds against the mark scheme, point by point, with the Study Helper on hand if you get stuck.

  • 17 questions
  • 1–6 marks each
  • Instant marking
  • No sign-up needed
17 questions, marked as you go

Sample questions with model answers

Here are 4 of the questions in this topic, each with a model answer, an explanation of why it earns the marks and the mark scheme an examiner would use.

Question 1

1 mark

For a set of data, \(y\) always increases as \(x\) increases, but the points on a scatter graph lie on a curve, not a straight line.

Which of these is true for the data?

Choose your answer.

  • \(r_s = 1\) and PMCC \(= 1\)
  • \(r_s = 1\) and PMCC \(< 1\)
  • \(r_s < 1\) and PMCC \(= 1\)
  • \(r_s < 1\) and PMCC \(< 1\)

Model answer

\(r_s = 1\) and PMCC \(< 1\). As \(x\) increases \(y\) always increases, so the ranks of \(x\) and \(y\) are in exactly the same order and \(r_s = 1\). The points are not on a straight line, so the PMCC is less than 1.

Explanation

Spearman's coefficient measures the correlation of the rank orders, so any relationship where y always increases with x gives 1. Pearson's PMCC measures the linear relationship, so it is 1 only when the points lie exactly on a straight line with positive gradient.

Mark scheme
  1. 1 mark

    B1 for \(r_s = 1\) and PMCC \(< 1\)

    Accept the option written in words, eg 'Spearman's is 1 and the PMCC is less than 1'. Any other answer, or more than one answer, scores B0.
Question 2

2 marks

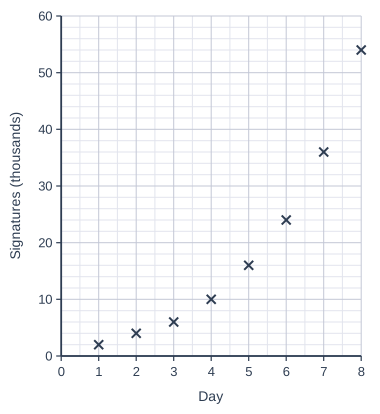
An online petition was launched. The scatter graph shows the total number of signatures, in thousands, at the end of each of the first 8 days.

The product moment correlation coefficient (PMCC) for these data is 0.937 (to 3 decimal places).

Write down the value of Spearman's rank correlation coefficient for these data.

Explain why it is different from the PMCC.

Scatter graph on a grid of small squares. The horizontal axis is "Day", from 0 to 8, numbered every 1, with 2 small squares between numbered values (each small square is 0.5). The vertical axis is "Signatures (thousands)", from 0 to 60, numbered every 10, with 5 small squares between numbered values (each small square is 2). 8 points are plotted as crosses: (1, 2), (2, 4), (3, 6), (4, 10), (5, 16), (6, 24), (7, 36) and (8, 54).

Model answer

Spearman's rank correlation coefficient is 1.

Each day the total is higher than the day before, so the days and the totals are ranked in exactly the same order and \(r_s = 1\). The PMCC measures how close the points are to a straight line. These points lie on a curve that gets steeper, so the PMCC is less than 1.

Explanation

Spearman's coefficient measures the correlation of the rank orders, so it is 1 whenever y always increases with x. Pearson's PMCC measures the linear relationship, so a curved pattern gives a value below 1 even when the points follow the curve exactly.

Mark scheme
  1. 1 mark

    B1 for 1

    Accept +1.

  2. 1 mark

    B1 for the total always increases as the number of days increases, so the ranks are in exactly the same order (giving 1), but the points lie on a curve, not a straight line, so the PMCC is less than 1

    oe. Must explain the PMCC with reference to the curve or the points not lying on a straight line (accept 'the relationship is not linear' when linked to the PMCC measuring a linear relationship), eg 'Spearman's only measures the rank order, but the PMCC measures how close the points are to a straight line, and these points curve upwards'. Any reason referring to outliers B0. 'The PMCC is less accurate' B0.

Question 3

3 marks

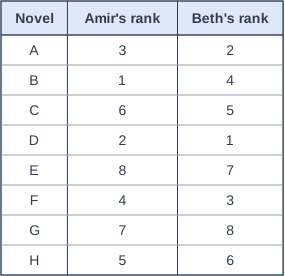
Two members of a book club, Amir and Beth, each ranked the same 8 novels, A to H, in order of preference. Rank 1 is their favourite.
The table shows the ranks.

Use \(r_s = 1 - \dfrac{6\sum d^2}{n(n^2 - 1)}\) to calculate Spearman's rank correlation coefficient for Amir's and Beth's rankings.
Give your answer to 2 decimal places.

Table with columns "Novel", "Amir's rank", "Beth's rank". Novel: A; Amir's rank: 3; Beth's rank: 2 | Novel: B; Amir's rank: 1; Beth's rank: 4 | Novel: C; Amir's rank: 6; Beth's rank: 5 | Novel: D; Amir's rank: 2; Beth's rank: 1 | Novel: E; Amir's rank: 8; Beth's rank: 7 | Novel: F; Amir's rank: 4; Beth's rank: 3 | Novel: G; Amir's rank: 7; Beth's rank: 8 | Novel: H; Amir's rank: 5; Beth's rank: 6.

Model answer

Differences, \(d\) (Amir - Beth): 1, -3, 1, 1, 1, 1, -1, -1

\(\sum d^2 = 1 + 9 + 1 + 1 + 1 + 1 + 1 + 1 = 16\)

\(r_s = 1 - \dfrac{6 \times 16}{8(8^2 - 1)} = 1 - \dfrac{96}{504} = 0.8095...\)

\(r_s = 0.81\) (2 decimal places)

Explanation

Find the difference between the two ranks for each novel, square the differences and add them. Here n = 8, so the denominator is 8 × 63 = 504. Common errors are forgetting to subtract from 1, using the wrong value of n, and squaring the sum of the differences instead of adding the squares.

Mark scheme
  1. 1 mark

    M1 for a correct method for \(\sum d^2\) (= 16)

    Allow one error. The differences are 1, -3, 1, 1, 1, 1, -1, -1 (or the negatives of these) and the squared differences are 1, 9, 1, 1, 1, 1, 1, 1.

  2. 1 mark

    M1dep for \(1 - \dfrac{6 \times 16}{8(8^2 - 1)}\)

    oe, eg \(1 - \dfrac{96}{504}\). ft their \(\sum d^2\). If '1 -' is seen it must be in the correct place.

  3. 1 mark

    A1 for 0.81

    Accept [0.805, 0.815], eg 0.8095 or \(\dfrac{17}{21}\). Correct answer with no working scores 3 marks (a calculator can do the work). 0.19 (forgetting to subtract from 1) scores M1M0A0.

Question 4

4 marks

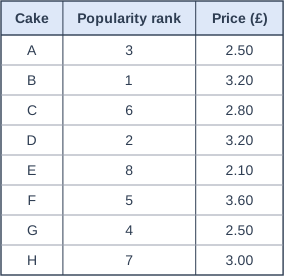
A cafe sells 8 types of cake, A to H. The owner ranked the cakes by how popular they are, with rank 1 for the most popular.
The table shows these ranks and the price of each cake.

Rank the prices so that the most expensive cake has rank 1.
Then use \(r_s = 1 - \dfrac{6\sum d^2}{n(n^2 - 1)}\) to calculate Spearman's rank correlation coefficient between popularity and price.
Give your answer to 2 decimal places.

Table with columns "Cake", "Popularity rank", "Price (£)". Cake: A; Popularity rank: 3; Price (£): 2.50 | Cake: B; Popularity rank: 1; Price (£): 3.20 | Cake: C; Popularity rank: 6; Price (£): 2.80 | Cake: D; Popularity rank: 2; Price (£): 3.20 | Cake: E; Popularity rank: 8; Price (£): 2.10 | Cake: F; Popularity rank: 5; Price (£): 3.60 | Cake: G; Popularity rank: 4; Price (£): 2.50 | Cake: H; Popularity rank: 7; Price (£): 3.00.

Model answer

Price ranks (most expensive = 1): A 6.5, B 2.5, C 5, D 2.5, E 8, F 1, G 6.5, H 4

Differences, \(d\) (popularity rank - price rank): -3.5, -1.5, 1, -0.5, 0, 4, -2.5, 3

\(\sum d^2 = 12.25 + 2.25 + 1 + 0.25 + 0 + 16 + 6.25 + 9 = 47\)

\(r_s = 1 - \dfrac{6 \times 47}{8(8^2 - 1)} = 1 - \dfrac{282}{504} = 0.4404...\)

\(r_s = 0.44\) (2 decimal places)

Explanation

Tied prices take the mean of the ranks they share: £3.20 is ranked 2.5 and 2.5, and £2.50 is ranked 6.5 and 6.5. Both variables are ranked from 'most' to 'least' so the sign of the coefficient is meaningful: 0.44 is weak positive correlation, so more popular cakes tend to be slightly more expensive.

Mark scheme
  1. 1 mark

    B1 for price ranks 6.5, 2.5, 5, 2.5, 8, 1, 6.5, 4 (cakes A to H)

    The two cakes at £3.20 share ranks 2 and 3 (2.5 each) and the two at £2.50 share ranks 6 and 7 (6.5 each).

  2. 1 mark

    M1 for a correct method for \(\sum d^2\) (= 47)

    Allow one error. The differences (popularity - price rank) are -3.5, -1.5, 1, -0.5, 0, 4, -2.5, 3. ft their price ranks.

  3. 1 mark

    M1dep for \(1 - \dfrac{6 \times 47}{8(8^2 - 1)}\)

    oe, eg \(1 - \dfrac{282}{504}\). ft their \(\sum d^2\).

  4. 1 mark

    A1 for 0.44

    Accept [0.43, 0.445], eg 0.4405 or \(\dfrac{37}{84}\). A calculator working out the PMCC of the ranks gives 0.4338 (0.43 to 2 decimal places), which is also accepted. Correct answer with no working scores 4 marks. Giving tied prices the same top rank (2, 2 and 6, 6) gives 0.52: B0M1M1A0; giving them the same bottom rank (3, 3 and 7, 7) gives 0.33: B0M1M1A0. Ranking the prices with the cheapest as rank 1 gives -0.42: B0M1M1A0.

Ready to try the rest? Every answer you write is marked against the mark scheme, so you can see exactly where the marks are.

Study Helper Hints first, answers after you try

Stuck on this one? Ask for a hint and I’ll point you in the right direction, without giving the answer away. Once you’ve checked your answer, I’ll show you how the marks are awarded.