
Level:
Correct: 0
Incorrect: 0
Marks: 0/0
Exam Practice
Course:
Topics:
AQA GCSE Statistics (Higher Paper 1) Smart practice A mixed round aimed at your weak spots
Unit 1
Planning and collecting data
Unit 2
Representing data
Section C: C1a (tabulation, tally, pictogram); Section E: E3d
Tabulation, tallies, pictograms and tables of data
Section C: C1a (pie chart), C1b (comparative pie chart)
Pie charts and comparative pie charts
Section C: C1a (stem and leaf diagram)
Stem and leaf diagrams
Section C: C2 (bar charts, bar line charts, line charts, frequency polygons)
Bar charts, line charts and frequency polygons
Section C: C2 (cumulative frequency charts)
Cumulative frequency diagrams
Section C: C2 (histograms), C3b
Histograms and frequency density
Section C: C2 (box plots); Section D: D3b; Section E: E5b
Box plots and outliers
Unit 3
Summarising data
Section D: D1a (mode, median, arithmetic mean)
Mode, median and mean
Section D: D1a (weighted mean, geometric mean), D1b
Weighted mean, geometric mean and choosing an average
Section D: D2; Section E: E5a
Skewness
Section D: D3a (range, quartiles, IQR, percentiles, interpercentile and interdecile range)
Range, quartiles, percentiles and interdecile range
Section D: D3a (standard deviation)
Standard deviation
Section C: C2 (time series); Section D: D1a (mean seasonal variation), D4; Section E: E6
Time series, moving averages and seasonal variation
Section C: C2 (scatter charts); Section D: D5
Scatter diagrams, lines of best fit and regression lines
Section D: D6; Section E: E9a, E9b, E9c
Spearman's rank correlation coefficient
Unit 4
Probability
Unit 5
Interpreting and evaluating results
Unit 6
Statistical enquiry cycle
3.6 Statistical enquiry cycle: 3.6.1 Initial planning, 3.6.2 Data collection
Statistical enquiry cycle: planning and data collection
3.6 Statistical enquiry cycle: 3.6.3 Processing and presentation, 3.6.4 Interpretation, 3.6.5 Evaluation
Statistical enquiry cycle: analysis and evaluation
Avg
score:
–
Topics
done:
0/39

Two-way tables, sample spaces, tree and Venn diagrams

Practise 18 exam-style questions on Two-way tables, sample spaces, tree and Venn diagrams for AQA GCSE Statistics (Higher Paper 1). Write your answer as you would in the exam and get it marked in seconds against the mark scheme, point by point, with the Study Helper on hand if you get stuck.

  • 18 questions
  • 1–5 marks each
  • Instant marking
  • No sign-up needed
18 questions, marked as you go

Sample questions with model answers

Here are 4 of the questions in this topic, each with a model answer, an explanation of why it earns the marks and the mark scheme an examiner would use.

Question 1

1 mark

Three friends each choose pizza or pasta for lunch.
Each friend is equally likely to choose pizza or pasta, and they choose independently.

Work out the probability that the three friends do not all choose the same food.

Model answer

Sample space (pizza P, pasta A): PPP, PPA, PAP, APP, PAA, APA, AAP, AAA - 8 equally likely outcomes.
All the same: PPP and AAA - 2 outcomes.
P(not all the same) \(= 1 - \dfrac{2}{8} = \dfrac{6}{8} = \dfrac{3}{4}\)

Explanation

With three events, list the sample space systematically (or use a three-stage tree): \(2 \times 2 \times 2 = 8\) outcomes. Only two outcomes have all three choosing the same food, so the rest, 6 out of 8, do not.

Mark scheme
  1. 1 mark

    B1 for \(\dfrac{6}{8}\) oe

    oe, eg \(\dfrac{3}{4}\), 0.75, 75%. The sample space has 8 equally likely outcomes, and only 2 (all pizza, all pasta) have all three the same. \(\dfrac{2}{8}\) or \(\dfrac{1}{4}\) (all the same) scores B0. An answer written as a ratio (6 : 8) or in words (6 out of 8) scores B0, and a percentage must have the % sign. Correct answer with no working scores B1.
Question 2

2 marks

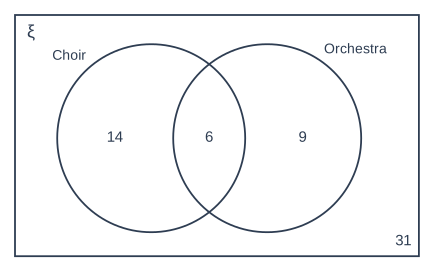
The Venn diagram shows information about whether 60 students sing in the school choir and whether they play in the school orchestra.

A student is chosen at random from the 60 students.

Work out the probability that the student is in exactly one of the two groups.

A Venn diagram: a rectangle labelled ΞΎ (the universal set) containing two overlapping circles labelled "Choir" and "Orchestra". The numbers written in each region are: in "Choir" only: 14; in both "Choir" and "Orchestra": 6; in "Orchestra" only: 9; outside both circles: 31.

Model answer

Exactly one group: choir only + orchestra only \(= 14 + 9 = 23\)
Probability \(= \dfrac{23}{60}\)

Explanation

'Exactly one' means in one circle but not the overlap: the choir-only region (14) and the orchestra-only region (9). Including the 6 in the overlap gives 'at least one' instead, and the 31 outside the circles are in neither group.

Mark scheme
  1. 2 marks

    B2 for \(\dfrac{23}{60}\) oe

    oe, eg 0.383(3...), 38.3%; condone 0.38 with fully correct working. B1 for 23 seen (\(14 + 9\)), or for a fraction with denominator 60 and numerator less than 60 (eg \(\dfrac{29}{60}\), which includes the 6 students in both groups). Ignore any attempt to convert or simplify once the correct answer is seen. A percentage must have the % sign. An answer written as a ratio (23 : 60) or in words (23 out of 60) scores B1. Correct answer with no working scores B2.

Question 3

3 marks

A box contains 12 chocolates. 5 of the chocolates are dark and 7 are milk.
Liam takes two chocolates at random from the box, without replacement.

Work out the probability that the two chocolates are the same type.

Model answer

P(both dark) \(= \dfrac{5}{12} \times \dfrac{4}{11} = \dfrac{20}{132}\)
P(both milk) \(= \dfrac{7}{12} \times \dfrac{6}{11} = \dfrac{42}{132}\)
P(same type) \(= \dfrac{20}{132} + \dfrac{42}{132} = \dfrac{62}{132} = \dfrac{31}{66}\)

Explanation

Without replacement, the second probabilities change: after one dark chocolate is taken there are 4 dark left out of 11. 'Same type' means both dark or both milk, so add the two paths. A common error is to keep the denominator 12 for the second chocolate, as if it were put back.

Mark scheme
  1. 1 mark

    M1 for \(\dfrac{5}{12} \times \dfrac{4}{11}\) or \(\dfrac{20}{132}\), or \(\dfrac{7}{12} \times \dfrac{6}{11}\) or \(\dfrac{42}{132}\)

    oe. If decimals are used they must be correct to at least 3 decimal places (0.152 or 0.318). SC1 for \(\dfrac{74}{144}\) oe (0.514) from treating the choices as with replacement (\(\dfrac{5}{12} \times \dfrac{5}{12} + \dfrac{7}{12} \times \dfrac{7}{12}\)): award 1 mark in total.

  2. 1 mark

    M1dep for \(\dfrac{5}{12} \times \dfrac{4}{11} + \dfrac{7}{12} \times \dfrac{6}{11}\) oe

    oe. Alternative: \(1 - 2 \times \dfrac{5}{12} \times \dfrac{7}{11}\).

  3. 1 mark

    A1 for \(\dfrac{62}{132}\) oe

    oe, eg \(\dfrac{31}{66}\), 0.47 [0.469, 0.47]. Ignore any attempt to convert or simplify once the correct answer is seen. A probability written as a ratio (62 : 132) or in words (62 out of 132) scores M1M1A0; a percentage must have the % sign. Correct answer with no working scores full marks.

Question 4

4 marks

A factory has two machines, A and B, that make phone cases.
Machine A makes 60% of the cases and machine B makes the rest.
3% of the cases made by machine A are faulty.
5% of the cases made by machine B are faulty.

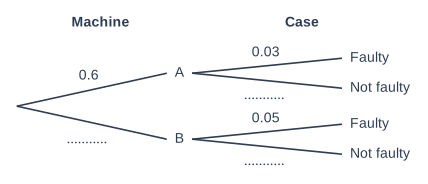
The tree diagram shows some of this information.

The factory makes a batch of 2500 phone cases.
Work out an estimate of the number of faulty cases in the batch.

A probability tree diagram drawn from left to right with 2 stages of branches, headed "Machine" and "Case". Each branch has its outcome written at its end and its probability written beside it. First stage, 2 branches: "A" with probability 0.6, "B" with probability left blank (a dotted line to fill in). After "A", the second stage branches are "Faulty" with probability 0.03, "Not faulty" with probability left blank (a dotted line to fill in). After "B", the second stage branches are "Faulty" with probability 0.05, "Not faulty" with probability left blank (a dotted line to fill in).

Model answer

P(A and faulty) \(= 0.6 \times 0.03 = 0.018\)
P(B and faulty) \(= 0.4 \times 0.05 = 0.02\)
P(faulty) \(= 0.018 + 0.02 = 0.038\)
Expected number of faulty cases \(= 0.038 \times 2500 = 95\)

Explanation

The missing branches are 0.4 (machine B), 0.97 and 0.95 (not faulty). A case can be faulty in two ways, from machine A or from machine B, so multiply along both 'faulty' paths and add. Then expected frequency = probability \(\times\) 2500. Averaging 3% and 5% is wrong because the machines make different amounts.

Mark scheme
  1. 1 mark

    M1 for \(0.6 \times 0.03\) or 0.018

    oe. Alternative method using frequencies: M1 for \(2500 \times 0.6 \times 0.03\) or 45.

  2. 1 mark

    M1 for \(0.4 \times 0.05\) or 0.02

    oe. Alternative method: M1 for \(2500 \times 0.4 \times 0.05\) or 50.

  3. 1 mark

    A1 for 0.038

    oe, eg 3.8%. Alternative method: A1 for \(45 + 50\).

  4. 1 mark

    B1ft for 95

    ft \(2500 \times\) their probability of a faulty case (less than 1), given as a whole number (rounded or truncated) if necessary. Using \((0.03 + 0.05) \div 2 \times 2500 = 100\) (the mean of the two percentages) scores M0M0A0B0. Correct answer with no working scores full marks.

Ready to try the rest? Every answer you write is marked against the mark scheme, so you can see exactly where the marks are.

Study Helper Hints first, answers after you try

Stuck on this one? Ask for a hint and I’ll point you in the right direction, without giving the answer away. Once you’ve checked your answer, I’ll show you how the marks are awarded.