Question 1
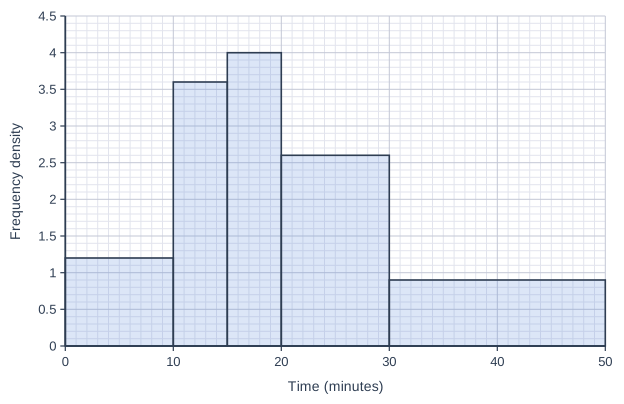
1 markThe histogram shows the times, in minutes, that 94 customers spent in a shop.
Which class contains the greatest number of customers?
Model answer
Frequency = frequency density × class width:
\(0 < t \le 10\): 1.2 × 10 = 12
\(10 < t \le 15\): 3.6 × 5 = 18
\(15 < t \le 20\): 4 × 5 = 20
\(20 < t \le 30\): 2.6 × 10 = 26
\(30 < t \le 50\): 0.9 × 20 = 18
The greatest number of customers is in the class \(20 < t \le 30\).
Explanation
In a histogram the area of a bar shows the frequency, so the tallest bar does not always have the greatest frequency. Multiply each height (frequency density) by its class width: the wider bar from 20 to 30 minutes has the largest area.
Mark scheme
-
1 mark
B1 for \(20 < t \le 30\)
oe, eg '20 to 30 minutes'. The frequencies are 12, 18, 20, 26, 18 (frequency density × class width). \(15 < t \le 20\) (the tallest bar, frequency 20) scores B0.