
Level:
Correct: 0
Incorrect: 0
Marks: 0/0
Exam Practice
Course:
Topics:
AQA GCSE Statistics (Higher Paper 1) Smart practice A mixed round aimed at your weak spots
Unit 1
Planning and collecting data
Unit 2
Representing data
Section C: C1a (tabulation, tally, pictogram); Section E: E3d
Tabulation, tallies, pictograms and tables of data
Section C: C1a (pie chart), C1b (comparative pie chart)
Pie charts and comparative pie charts
Section C: C1a (stem and leaf diagram)
Stem and leaf diagrams
Section C: C2 (bar charts, bar line charts, line charts, frequency polygons)
Bar charts, line charts and frequency polygons
Section C: C2 (cumulative frequency charts)
Cumulative frequency diagrams
Section C: C2 (histograms), C3b
Histograms and frequency density
Section C: C2 (box plots); Section D: D3b; Section E: E5b
Box plots and outliers
Unit 3
Summarising data
Section D: D1a (mode, median, arithmetic mean)
Mode, median and mean
Section D: D1a (weighted mean, geometric mean), D1b
Weighted mean, geometric mean and choosing an average
Section D: D2; Section E: E5a
Skewness
Section D: D3a (range, quartiles, IQR, percentiles, interpercentile and interdecile range)
Range, quartiles, percentiles and interdecile range
Section D: D3a (standard deviation)
Standard deviation
Section C: C2 (time series); Section D: D1a (mean seasonal variation), D4; Section E: E6
Time series, moving averages and seasonal variation
Section C: C2 (scatter charts); Section D: D5
Scatter diagrams, lines of best fit and regression lines
Section D: D6; Section E: E9a, E9b, E9c
Spearman's rank correlation coefficient
Unit 4
Probability
Unit 5
Interpreting and evaluating results
Unit 6
Statistical enquiry cycle
3.6 Statistical enquiry cycle: 3.6.1 Initial planning, 3.6.2 Data collection
Statistical enquiry cycle: planning and data collection
3.6 Statistical enquiry cycle: 3.6.3 Processing and presentation, 3.6.4 Interpretation, 3.6.5 Evaluation
Statistical enquiry cycle: analysis and evaluation
Avg
score:
–
Topics
done:
0/39

Random, systematic and quota sampling

Practise 15 exam-style questions on Random, systematic and quota sampling for AQA GCSE Statistics (Higher Paper 1). Write your answer as you would in the exam and get it marked in seconds against the mark scheme, point by point, with the Study Helper on hand if you get stuck.

  • 15 questions
  • 1–6 marks each
  • Instant marking
  • No sign-up needed
15 questions, marked as you go

Sample questions with model answers

Here are 4 of the questions in this topic, each with a model answer, an explanation of why it earns the marks and the mark scheme an examiner would use.

Question 1

1 mark

A zoo knows from its ticket sales that 35% of its visitors are under 18, 40% are aged 18 to 64 and 25% are aged 65 and over.
A researcher interviews 80 visitors one day. She uses a quota sample: 28 visitors under 18, 32 aged 18 to 64 and 20 aged 65 and over.

Give one advantage of using this quota sample rather than an opportunity sample of the first 80 visitors she meets.

Model answer

The quota sample is certain to contain visitors from each age group in the same proportions as all the zoo's visitors (28, 32 and 20). The first 80 visitors she meets could be mostly from one age group - for example a school party - so an opportunity sample could easily be unrepresentative.

Explanation

Quota sampling improves on opportunity sampling by fixing how many people come from each group, using known population proportions (here from ticket sales). It is still not random: within each group the interviewer chooses who to ask, so some bias can remain. A common error is to describe quota sampling as random.

Mark scheme
  1. 1 mark

    B1 for the quota sample makes sure that each age group is represented in the same proportion as in all the zoo's visitors, whereas the first 80 visitors she meets could be mostly from one age group (eg a school party)

    oe. Accept 'the sample will be more representative of the ages of the visitors' or 'every age group will be included in the right proportion'. Do not accept 'it is random' or 'it is unbiased' (the interviewer still chooses who to ask), 'it is quicker' (it is not quicker than an opportunity sample) or 'it is fair'. Do not allow a correct statement with an incorrect statement.
Question 2

2 marks

A sports club has 1260 members on a numbered list.
The secretary takes a systematic sample of 42 members from the list. The first member chosen is number 17.

Work out the number on the list of the last member chosen.

Model answer

Sampling interval \(= 1260 \div 42 = 30\)
The members chosen are 17, 47, 77, ..., so the 42nd member chosen is
\(17 + 41 \times 30 = 1247\)

Explanation

In a systematic sample the interval is the population size divided by the sample size, here 30. The first member is number 17, so the \(n\)th member chosen is \(17 + (n - 1) \times 30\). A common error is to add 42 lots of 30, which gives 1277, a number beyond the end of the list.

Mark scheme
  1. 1 mark

    M1 for \(1260 \div 42 = 30\) (the sampling interval) or 17, 47, 77, ... seen

    oe. The interval 30 may be implied by a correct answer.

  2. 1 mark

    A1 for 1247

    Correct answer with no working scores M1A1. \(17 + 42 \times 30 = 1277\) (one step too many, and beyond the end of the list) scores M1A0. Using an interval of 42 (eg \(17 + 41 \times 42 = 1739\)) scores M0A0.

Question 3

3 marks

A council wants to ask 200 residents about plans for a new leisure centre. It wants each age group to be represented in proportion to its size in the town.
It is deciding between a quota sample and a stratified random sample, both based on age group.

Give one similarity and two differences between the ways in which the two samples would be chosen.

Model answer

Similarity: both split the residents into age groups and take a number from each age group in proportion to the size of that group.
Difference 1: in the quota sample the interviewer chooses who to ask until each age quota is full, but in the stratified random sample the residents in each age group are chosen at random.
Difference 2: the stratified random sample needs a list of all the residents in each age group so that they can be numbered, but the quota sample needs no list, so it is quicker and cheaper.

Explanation

Quota sampling and stratified sampling use the same proportional numbers from each group; the difference is how the members of each group are picked. In a stratified random sample they are chosen at random from a list, which needs a sampling frame; in a quota sample the interviewer chooses them, which is quicker but open to interviewer bias. Remember that stratification is not itself a method of sampling - it is done before sampling.

Mark scheme
  1. 1 mark

    B1 for a similarity, eg both divide the residents into age groups and take a number of residents from each age group in proportion to the size of the group

    oe. Accept 'the two samples would contain the same numbers of residents from each age group as each other'. Do not accept 'both take equal numbers from each age group' (the numbers are in proportion to the group sizes, not equal). 'Both are samples' or 'both ask 200 people' B0.

  2. 1 mark

    B1 for a first difference, eg in a quota sample the interviewer chooses which residents to ask until each quota is filled (not random), but in a stratified random sample the residents in each age group are chosen at random

    oe. 'One is random and the other is not' scores only if it says which is which.

  3. 1 mark

    B1 for a second, different difference, eg a stratified random sample needs a list (sampling frame) of the residents in each age group, but a quota sample does not / a quota sample is quicker or cheaper / in a quota sample, people who refuse are just replaced by others who are willing, so non-response is hidden

    oe. The two differences must come from different categories: (1) who chooses the people (random selection or the interviewer's choice, including interviewer bias); (2) the need for a sampling frame; (3) time or cost; (4) how refusals are dealt with. Two differences from the same category score B1 only. Ignore any non-contradictory or irrelevant statements.

Question 4

5 marks

A market researcher wants to interview 80 adults who live in a town. She will use a quota sample based on age group and gender, with each group in proportion to the adult population of the town. She will knock on doors in the town on weekday afternoons until each quota is filled.

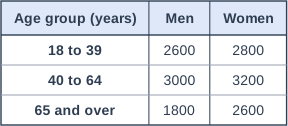
The table shows the adult population of the town.

Work out how many adults she should interview in each of the six groups.
Then give two different reasons why her results may be biased, even though her quotas match the population.

Table with columns "Age group (years)", "Men", "Women". Age group (years): 18 to 39; Men: 2600; Women: 2800 | Age group (years): 40 to 64; Men: 3000; Women: 3200 | Age group (years): 65 and over; Men: 1800; Women: 2600.

Model answer

Total adult population \(= 2600 + 2800 + 3000 + 3200 + 1800 + 2600 = 16000\)
\(\dfrac{80}{16000} = \dfrac{1}{200}\), so divide each group by 200:
Men 18 to 39: \(2600 \div 200 = 13\); women 18 to 39: \(2800 \div 200 = 14\)
Men 40 to 64: \(3000 \div 200 = 15\); women 40 to 64: \(3200 \div 200 = 16\)
Men 65 and over: \(1800 \div 200 = 9\); women 65 and over: \(2600 \div 200 = 13\)
Check: \(13 + 14 + 15 + 16 + 9 + 13 = 80\)

Reason 1: she only interviews people who are at home on weekday afternoons, so adults who are at work then cannot be chosen. Her quotas for the younger age groups will be filled with people who are not at work, who may have different views.
Reason 2: she chooses which streets and houses to visit, so she may avoid some, for example blocks of flats or houses that look unwelcoming.

Explanation

Quotas are worked out like a stratified sample: each group's share of the population times the sample size. But a quota sample is not random: the interviewer chooses who to ask, and only people who are available at that time can be chosen, so bias can still enter. Two reasons must be genuinely different, not the same idea in different words.

Mark scheme
  1. 1 mark

    M1 for the total 16 000 and \(\dfrac{\text{group size}}{16000} \times 80\) for at least one group (eg \(\dfrac{2600}{16000} \times 80\)), or for dividing a group size by 200

    oe. Accept use of the fraction \(\dfrac{80}{16000} = \dfrac{1}{200}\) or 0.005.

  2. 1 mark

    A1 for at least three correct quotas

    The quotas are: men 18 to 39: 13, women 18 to 39: 14, men 40 to 64: 15, women 40 to 64: 16, men 65 and over: 9, women 65 and over: 13.

  3. 1 mark

    A1 for all six correct: men 18 to 39: 13, women 18 to 39: 14, men 40 to 64: 15, women 40 to 64: 16, men 65 and over: 9, women 65 and over: 13

    Correct quotas with no working score M1A1A1. The six quotas add to 80.

  4. 1 mark

    B1 for a first valid reason, eg only people who are at home on weekday afternoons can be interviewed, so adults who work or study during the day are missed and the quotas are filled with people who may have different views / the interviewer chooses which streets and houses to visit, or who to ask, so she may avoid some (eg blocks of flats or houses that look unwelcoming) (interviewer selection bias) / people who refuse are replaced by people who are willing to talk

    oe. Accept 'the interviewer is not choosing randomly'. Do not accept 'the sample is too small' or 'people may lie'.

  5. 1 mark

    B1 for a second valid reason from a different category

    The two reasons must come from different categories: (1) interviewer selection bias (choice of streets, houses or people); (2) the time of the interviews (who is at home on weekday afternoons); (3) non-response (refusals replaced by willing people); (4) other characteristics not controlled by the quotas (eg employment or which part of the town people live in). Two reasons from the same category score B1 only. Ignore any non-contradictory or irrelevant statements.

Ready to try the rest? Every answer you write is marked against the mark scheme, so you can see exactly where the marks are.

Study Helper Hints first, answers after you try

Stuck on this one? Ask for a hint and I’ll point you in the right direction, without giving the answer away. Once you’ve checked your answer, I’ll show you how the marks are awarded.