
Level:
Correct: 0
Incorrect: 0
Marks: 0/0
Exam Practice
Course:
Topics:
AQA GCSE Statistics (Higher Paper 1) Smart practice A mixed round aimed at your weak spots
Unit 1
Planning and collecting data
Unit 2
Representing data
Section C: C1a (tabulation, tally, pictogram); Section E: E3d
Tabulation, tallies, pictograms and tables of data
Section C: C1a (pie chart), C1b (comparative pie chart)
Pie charts and comparative pie charts
Section C: C1a (stem and leaf diagram)
Stem and leaf diagrams
Section C: C2 (bar charts, bar line charts, line charts, frequency polygons)
Bar charts, line charts and frequency polygons
Section C: C2 (cumulative frequency charts)
Cumulative frequency diagrams
Section C: C2 (histograms), C3b
Histograms and frequency density
Section C: C2 (box plots); Section D: D3b; Section E: E5b
Box plots and outliers
Unit 3
Summarising data
Section D: D1a (mode, median, arithmetic mean)
Mode, median and mean
Section D: D1a (weighted mean, geometric mean), D1b
Weighted mean, geometric mean and choosing an average
Section D: D2; Section E: E5a
Skewness
Section D: D3a (range, quartiles, IQR, percentiles, interpercentile and interdecile range)
Range, quartiles, percentiles and interdecile range
Section D: D3a (standard deviation)
Standard deviation
Section C: C2 (time series); Section D: D1a (mean seasonal variation), D4; Section E: E6
Time series, moving averages and seasonal variation
Section C: C2 (scatter charts); Section D: D5
Scatter diagrams, lines of best fit and regression lines
Section D: D6; Section E: E9a, E9b, E9c
Spearman's rank correlation coefficient
Unit 4
Probability
Unit 5
Interpreting and evaluating results
Unit 6
Statistical enquiry cycle
3.6 Statistical enquiry cycle: 3.6.1 Initial planning, 3.6.2 Data collection
Statistical enquiry cycle: planning and data collection
3.6 Statistical enquiry cycle: 3.6.3 Processing and presentation, 3.6.4 Interpretation, 3.6.5 Evaluation
Statistical enquiry cycle: analysis and evaluation
Avg
score:
–
Topics
done:
0/39

Statistical enquiry cycle: planning and data collection

Practise 19 exam-style questions on Statistical enquiry cycle: planning and data collection for AQA GCSE Statistics (Higher Paper 1). Write your answer as you would in the exam and get it marked in seconds against the mark scheme, point by point, with the Study Helper on hand if you get stuck.

  • 19 questions
  • 1–6 marks each
  • Instant marking
  • No sign-up needed
19 questions, marked as you go

Sample questions with model answers

Here are 4 of the questions in this topic, each with a model answer, an explanation of why it earns the marks and the mark scheme an examiner would use.

Question 1

1 mark

Leo is carrying out a statistical enquiry.
His hypothesis is 'Year 9 students who read for pleasure score higher on a vocabulary test than Year 9 students who do not read for pleasure.'

Which of these is part of the initial planning stage of his enquiry?

Choose your answer.

  • Calculating the median score for each group
  • Deciding what data to collect and how to collect it
  • Writing a summary of his findings for the school magazine
  • Suggesting a larger sample for next time

Model answer

Deciding what data to collect and how to collect it

Explanation

The statistical enquiry cycle has five stages: initial planning, data collection, processing and presentation, interpretation of results, and evaluation and review. Planning means writing the hypothesis and deciding what data to collect, how to collect and record it, and how it will be processed. Calculating medians is processing, writing up findings for an audience is interpretation and communication, and suggesting a larger sample is evaluation.

Mark scheme
  1. 1 mark

    B1 for Deciding what data to collect and how to collect it

    Accept any clear indication of this option. Any other answer, or more than one answer, scores B0.
Question 2

2 marks

Leah wants to test the hypothesis 'Students at her school who have asthma take part in fewer after-school sports clubs than students who do not have asthma.'
She asks the school office for a list of the students who have asthma.
The school refuses to give her the list.

Give a reason why the school will not give Leah this information.
Suggest how Leah could still collect data to test her hypothesis.

Model answer

Information about whether a student has asthma is confidential medical information, so the school cannot share it without permission.

Leah could give students an anonymous questionnaire (with their consent) asking whether they have asthma and how many after-school sports clubs they take part in.

Explanation

Sensitive data, such as health or income, are often confidential, which limits the data available to an investigator. A good plan finds another way to get the data that protects privacy, such as anonymous questionnaires with consent, or summary totals with no names.

Mark scheme
  1. 1 mark

    B1 for a reason, eg information about students' health (medical conditions) is confidential / it is personal data that the school cannot share without permission (data protection)

    oe. Must refer to confidentiality, privacy or personal/medical data. 'The school does not want to' B0. 'It would take too long' B0.

  2. 1 mark

    B1 for a suitable way of collecting the data, eg an anonymous questionnaire (with consent) asking students whether they have asthma and how many after-school sports clubs they go to / ask the school for anonymous totals, such as how many students with and without asthma attend the clubs (with no names)

    oe. The method must give data on both asthma and club attendance and must respect confidentiality. 'Ask the students' with no mention of anonymity or consent B0. 'Use secondary data from the internet' B0 unless it is about her school. 'Look at the students' medical records' B0.

Question 3

3 marks

A council wants to test the hypothesis 'Residents of the new housing estate use the bus less often than residents of the town centre.'
It will hand out a questionnaire at a community event that people from all over the town attend.

Write two questions for the questionnaire that would give the council the data it needs to test its hypothesis.
Include the response options for each question.

Model answer

Question 1: Where do you live? Tick one box.
On the new housing estate
In the town centre
Somewhere else

Question 2: In the last 7 days, how many single journeys did you make by bus? Tick one box.
0
1 to 2
3 to 5
6 to 9
10 or more

Explanation

Planning a questionnaire starts from the hypothesis. It compares two groups, so the council needs to know which group each person belongs to as well as how often they use the bus, and because people from all over the town attend, the first question needs an option for everyone else. The bus question needs a time period and numerical options that do not overlap and cover every possible answer, so that the two groups can be compared fairly.

Mark scheme
  1. 1 mark

    B1 for a question asking where the person lives, with response options that include the new housing estate, the town centre and an option for everyone else (eg 'Somewhere else')

    oe. The options must cover everyone who might answer: options of only 'New housing estate' and 'Town centre' B0 (people from all over the town attend). Accept a question asking for the name of the area or street where they live. A question asking for the person's name or full address B0 (it is not needed and is personal data).

  2. 1 mark

    B1 for a question about bus use that includes a time period (eg in the last 7 days, in a typical week) and makes clear what is being counted (eg the number of bus journeys)

    Both are needed. 'How often do you use the bus?' with no time period B0.

  3. 1 mark

    B1 for at least 3 numerical response options for the bus question that do not overlap and that cover every possible number of journeys, from 0 up to an open top option, eg 0 / 1 to 2 / 3 to 5 / 6 to 9 / 10 or more

    The number of journeys is a whole number, so options such as these do not overlap and leave no gaps. Options such as '0-2, 2-4, 4-6' (overlapping at 2 and 4) or '1-2, 3-4, 5-6' (missing 0 and more than 6) B0. Word options such as 'Often / Sometimes / Never' B0 (not numerical, and they mean different things to different people, so the two groups cannot be compared fairly).

Question 4

4 marks

Ruby is testing the hypothesis 'Students who use a laptop complete an online quiz more quickly than students who use a phone.'
The quiz closes 30 minutes after it starts.
Students typed the device they used and the time they took into an online form.
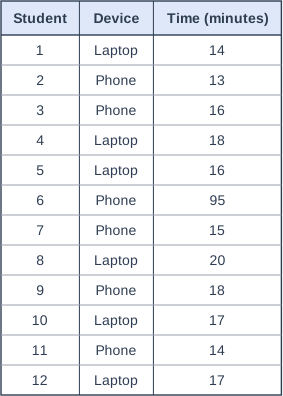
The table shows Ruby's data.

Ruby used a spreadsheet to work out the mean time for each device, using every value in the table.
She got 17 minutes for laptops and 28.5 minutes for phones, so she says that her hypothesis is supported.

Explain why Ruby's data must be cleaned before she draws a conclusion.
Clean the data and use a suitable calculation to decide whether the results support her hypothesis.

Table with columns "Student", "Device", "Time (minutes)". Student: 1; Device: Laptop; Time (minutes): 14 | Student: 2; Device: Phone; Time (minutes): 13 | Student: 3; Device: Phone; Time (minutes): 16 | Student: 4; Device: Laptop; Time (minutes): 18 | Student: 5; Device: Laptop; Time (minutes): 16 | Student: 6; Device: Phone; Time (minutes): 95 | Student: 7; Device: Phone; Time (minutes): 15 | Student: 8; Device: Laptop; Time (minutes): 20 | Student: 9; Device: Phone; Time (minutes): 18 | Student: 10; Device: Laptop; Time (minutes): 17 | Student: 11; Device: Phone; Time (minutes): 14 | Student: 12; Device: Laptop; Time (minutes): 17.

Model answer

Student 6's time of 95 minutes is impossible, because the quiz closes after 30 minutes. It must be an error, so it should be removed (or checked with student 6) before any calculation. Leaving it in makes the mean for phones far too large.

Laptop times: 14, 18, 16, 20, 17, 17
Mean \(= \dfrac{102}{6} = 17\) minutes

Phone times without the 95: 13, 16, 15, 18, 14
Mean \(= \dfrac{76}{5} = 15.2\) minutes

After cleaning, the students who used a phone took less time on average than the students who used a laptop (15.2 minutes compared with 17 minutes), so the results do not support Ruby's hypothesis.

Explanation

Cleaning means finding and dealing with values that cannot be right before the data are analysed. Use the context to spot them: here no time can be more than 30 minutes. An impossible value is not the same as a genuine outlier: it should be checked or removed, never kept or guessed. Here one error reverses the conclusion, which is why cleaning comes before any calculation.

Mark scheme
  1. 1 mark

    B1 for student 6's time of 95 minutes is impossible, because the quiz closes after 30 minutes, so it must be removed (or checked with the student and corrected) before the mean for phones is worked out

    oe. Must identify the 95 and say why it cannot be right (the 30-minute limit). 'The 95 is an outlier' alone B0 (a genuine value can be an outlier; this one is impossible). Changing the 95 to 9.5, or to any other guessed value, B0 (the true value is not known).

  2. 1 mark

    M1 for a correct calculation of an average for the phone users that is not distorted by the 95, eg the mean without the 95, \(\dfrac{13 + 16 + 15 + 18 + 14}{5}\), or the median of the phone times

    oe. The medians of the two groups are a suitable calculation: the median phone time is 15 with the 95 removed (15.5 if it is left in, which still scores this mark and the next, as the median is hardly affected by the 95) and the median laptop time is 17. Dividing by 6 after removing the 95 (12.7) M0. A guessed replacement for the 95 (eg 9.5, giving 14.25) M0.

  3. 1 mark

    A1 for 15.2 (minutes), the mean for phones after cleaning, seen with the laptop mean of 17 (minutes)

    Or the medians: 15 (or 15.5) for phones and 17 for laptops. The laptop mean of 17 is given in the question and may be quoted.

  4. 1 mark

    B1ft for No: after cleaning, the phone users took less time on average (15.2 minutes compared with 17 minutes), so the results do not support the hypothesis

    ft their values, provided the 95 has not been used in a mean. Must give a decision and compare the averages in context. 'Yes', or any conclusion based on 28.5 minutes, B0. Ignore any non-contradictory or irrelevant statements.

Ready to try the rest? Every answer you write is marked against the mark scheme, so you can see exactly where the marks are.

Study Helper Hints first, answers after you try

Stuck on this one? Ask for a hint and I’ll point you in the right direction, without giving the answer away. Once you’ve checked your answer, I’ll show you how the marks are awarded.