
Level:
Correct: 0
Incorrect: 0
Marks: 0/0
Exam Practice
Course:
Topics:
AQA GCSE Statistics (Higher Paper 1) Smart practice A mixed round aimed at your weak spots
Unit 1
Planning and collecting data
Unit 2
Representing data
Section C: C1a (tabulation, tally, pictogram); Section E: E3d
Tabulation, tallies, pictograms and tables of data
Section C: C1a (pie chart), C1b (comparative pie chart)
Pie charts and comparative pie charts
Section C: C1a (stem and leaf diagram)
Stem and leaf diagrams
Section C: C2 (bar charts, bar line charts, line charts, frequency polygons)
Bar charts, line charts and frequency polygons
Section C: C2 (cumulative frequency charts)
Cumulative frequency diagrams
Section C: C2 (histograms), C3b
Histograms and frequency density
Section C: C2 (box plots); Section D: D3b; Section E: E5b
Box plots and outliers
Unit 3
Summarising data
Section D: D1a (mode, median, arithmetic mean)
Mode, median and mean
Section D: D1a (weighted mean, geometric mean), D1b
Weighted mean, geometric mean and choosing an average
Section D: D2; Section E: E5a
Skewness
Section D: D3a (range, quartiles, IQR, percentiles, interpercentile and interdecile range)
Range, quartiles, percentiles and interdecile range
Section D: D3a (standard deviation)
Standard deviation
Section C: C2 (time series); Section D: D1a (mean seasonal variation), D4; Section E: E6
Time series, moving averages and seasonal variation
Section C: C2 (scatter charts); Section D: D5
Scatter diagrams, lines of best fit and regression lines
Section D: D6; Section E: E9a, E9b, E9c
Spearman's rank correlation coefficient
Unit 4
Probability
Unit 5
Interpreting and evaluating results
Unit 6
Statistical enquiry cycle
3.6 Statistical enquiry cycle: 3.6.1 Initial planning, 3.6.2 Data collection
Statistical enquiry cycle: planning and data collection
3.6 Statistical enquiry cycle: 3.6.3 Processing and presentation, 3.6.4 Interpretation, 3.6.5 Evaluation
Statistical enquiry cycle: analysis and evaluation
Avg
score:
–
Topics
done:
0/39

Skewness

Practise 16 exam-style questions on Skewness for AQA GCSE Statistics (Higher Paper 1). Write your answer as you would in the exam and get it marked in seconds against the mark scheme, point by point, with the Study Helper on hand if you get stuck.

  • 16 questions
  • 1–6 marks each
  • Instant marking
  • No sign-up needed
16 questions, marked as you go

Sample questions with model answers

Here are 4 of the questions in this topic, each with a model answer, an explanation of why it earns the marks and the mark scheme an examiner would use.

Question 1

1 mark

The histogram shows information about the times, in minutes, that 78 people spent in a library on one day.

Without doing any calculations, state whether the mean time is greater than or less than the median time.
Give a reason for your answer.
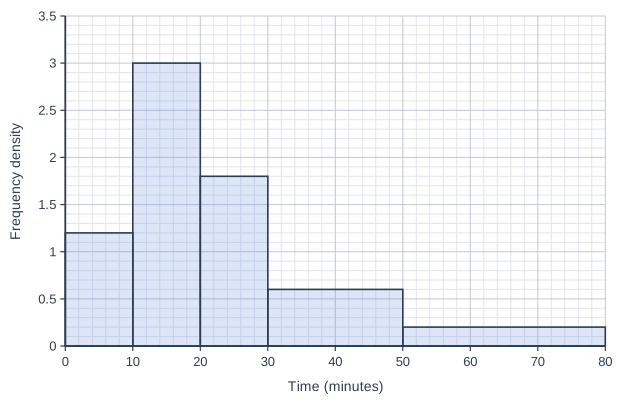
Histogram drawn on a grid of small squares. The horizontal axis is "Time (minutes)", from 0 to 80, numbered every 10, with 5 small squares between numbered values (each small square is 2). The vertical axis is "Frequency density", from 0 to 3.5, numbered every 0.5, with 5 small squares between numbered values (each small square is 0.1). The bars touch, with no gaps between them. Bars: from 0 to 10, height 1.2; from 10 to 20, height 3; from 20 to 30, height 1.8; from 30 to 50, height 0.6; from 50 to 80, height 0.2.

Model answer

The mean is greater than the median.
The tallest bar is for 10 to 20 minutes, and the bars are much lower over a long stretch of longer times up to 80 minutes, so the distribution has positive skew. The few people who stayed a long time pull the mean up, but they hardly affect the median.

Explanation

Read the shape from the heights (frequency densities), not the widths: most people stayed under 30 minutes and the low, wide bars on the right form a long tail of longer times, which is positive skew. In a positively skewed distribution the mean is greater than the median (here about 23.5 minutes against 19 minutes). For negative skew it is the other way round.

Mark scheme
  1. 1 mark

    B1 for the mean is greater than the median, with a reason, eg the distribution has positive skew / there is a long tail of longer times, and the few long times pull the mean up more than the median

    oe. Both the decision and a reason are needed. Accept 'positive skew, so mean > median' or 'skewed to the right'. Ignore any reference to the degree of skewness. 'Greater' with no reason, or with the reason 'the last bar is the widest', scores B0. 'Less than' or 'negative skew' scores B0. If calculations are given they must be correct (estimated mean 23.5 minutes, median 19 minutes).
Question 2

2 marks

The skew of the marks that students scored in a test is -0.62

The teacher then adds 5 bonus marks to every student's mark.

What is the skew of the new marks?
Give a reason for your answer.

Model answer

The skew is still -0.62.
Adding 5 to every mark increases the mean by 5 and the median by 5, so mean - median is unchanged. The marks are just as spread out as before, so the standard deviation is unchanged. So \(\dfrac{3(\text{mean} - \text{median})}{\text{standard deviation}}\) does not change.

Explanation

Adding the same amount to every value moves the whole distribution along without changing its shape or spread. Both averages move by the same amount and the standard deviation stays the same, so the skew is unchanged. A common error is to think the skew must change because the marks have changed.

Mark scheme
  1. 1 mark

    B1 for -0.62 / it does not change

    oe

  2. 1 mark

    B1dep for a correct reason, eg the mean and the median both increase by 5, so (mean - median) stays the same, and the standard deviation does not change

    oe. Depends on the first B1 (skew unchanged). Must refer to (mean - median) staying the same, or to the shape/spread of the marks not changing. Accept 'every mark moves up by 5 so the shape of the distribution is the same'. 'Because 5 is added to every mark' alone scores B0.

Question 3

3 marks

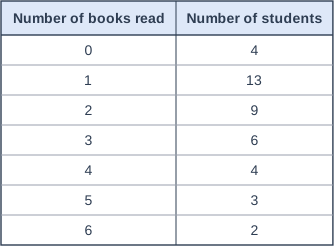
The table shows the numbers of books read last month by 41 students.

The mean number of books read is 2.24 (to 2 decimal places).

By finding the mode and the median, describe the skew of the data.
Give a reason for your answer.

Table with columns "Number of books read", "Number of students". Number of books read: 0; Number of students: 4 | Number of books read: 1; Number of students: 13 | Number of books read: 2; Number of students: 9 | Number of books read: 3; Number of students: 6 | Number of books read: 4; Number of students: 4 | Number of books read: 5; Number of students: 3 | Number of books read: 6; Number of students: 2.

Model answer

Mode = 1 book (the highest frequency, 13)
Median: the 21st value. Cumulative frequencies are 4, 17, 26, ... so the 21st value is 2 books.
mode (1) < median (2) < mean (2.24), so the data have positive skew.

Explanation

For the median of 41 values, find the 21st value using the cumulative frequencies. When the mode is less than the median and the median is less than the mean, the data are positively skewed: most students read only a few books and a few students read many. Common errors are giving the frequency 13 as the mode or not using the cumulative frequencies for the median.

Mark scheme
  1. 1 mark

    B1 for mode = 1

    Do not accept 13 (the frequency).

  2. 1 mark

    B1 for median = 2

    The median is the 21st value. Do not accept 9, 3 or 'the 21st' alone.

  3. 1 mark

    B1ft for positive skew with a reason, eg because mode < median < mean (1 < 2 < 2.24) / the mean is greater than the median

    ft their mode and median. The reason must compare at least two of the averages correctly; accept 'the mean (2.24) is greater than the median'. 'Positive' with no reason scores B0. Ignore any reference to the degree of skewness.

Question 4

5 marks

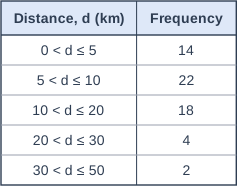
The table shows information about the distances, \(d\) km, that 60 employees of a company travel to work.

An estimate of the mean distance is 10.8 km.
An estimate of the standard deviation is 8.2 km.

Use the table to work out an estimate of the median distance.
Then use \(\text{skew} = \dfrac{3(\text{mean} - \text{median})}{\text{standard deviation}}\) to estimate the skew of the distances.
Give your answer to 2 decimal places.

Table with columns "Distance, d (km)", "Frequency". Distance, d (km): 0 < d ≤ 5; Frequency: 14 | Distance, d (km): 5 < d ≤ 10; Frequency: 22 | Distance, d (km): 10 < d ≤ 20; Frequency: 18 | Distance, d (km): 20 < d ≤ 30; Frequency: 4 | Distance, d (km): 30 < d ≤ 50; Frequency: 2.

Model answer

Cumulative frequencies: 14, 36, 54, 58, 60
The median is the 30th value, which is in the class \(5 < d \le 10\).
Median \(\approx 5 + \dfrac{30 - 14}{22} \times 5 = 5 + 3.636 = 8.636\) km
\(\text{skew} \approx \dfrac{3(10.8 - 8.636)}{8.2} = \dfrac{6.491}{8.2} = 0.79\) (to 2 decimal places)

Explanation

Use the cumulative frequencies to find which class holds the 30th distance, then assume the values are spread evenly through that class (interpolation). Because the data are grouped, the median, mean and standard deviation are all estimates, so the skew is too. A common error is to calculate the mean instead of the median; the positive skew shows that most employees live fairly close to work, with a few living much further away.

Mark scheme
  1. 1 mark

    B1 for identifying that the median is in the class \(5 < d \le 10\), or cumulative frequencies 14 and 36 seen

    Sight of the 30th or 30.5th value implies this mark if used with the correct class.

  2. 1 mark

    M1 for \(5 + \dfrac{30 - 14}{22} \times 5\) or \(5 + \dfrac{30.5 - 14}{22} \times 5\) oe

    oe, eg \(5 + \dfrac{16}{22} \times 5\)

  3. 1 mark

    A1 for median [8.63, 8.75]

    8.6(36...) from the 30th value or 8.75 from the 30.5th value.

  4. 1 mark

    M1 for \(\dfrac{3(10.8 - \text{their median})}{8.2}\)

    ft their median, provided it is between 5 and 10

  5. 1 mark

    A1 for 0.79 [0.75, 0.81]

    eg 0.79 from a median of 8.64, or 0.75 from a median of 8.75. Accept answers from more accurate values of the mean and standard deviation (10.83 and 8.20 give 0.80 or 0.76). The range is wider than one rounding unit only because both median positions (30th and 30.5th) and both versions of the mean and standard deviation are accepted; common wrong methods lie outside it (the class midpoint 7.5 as the median gives 1.21, the class boundary 10 gives 0.29). Correct answer with no working scores full marks. Using the mean of the class midpoints or the modal class instead of a median scores at most the final M1 if their median is between 5 and 10.

Ready to try the rest? Every answer you write is marked against the mark scheme, so you can see exactly where the marks are.

Study Helper Hints first, answers after you try

Stuck on this one? Ask for a hint and I’ll point you in the right direction, without giving the answer away. Once you’ve checked your answer, I’ll show you how the marks are awarded.